


Crude Oil Technical Forecast
- Brent oil price charts and analysis
- Crude Oil price action
Have you seen our newest trading guides for USD, EUR and Gold ? Download for free our latest forecasts
Brent Oil – From Zero to Hero
Last week, crude oil price had been struggling to clear $63.00 PB, then on Friday closed in the red with %2.7 loss. However, at the start of this weekly session Brent oil spiked to $71.03 – its highest level in nearly four months. The price slipped back after then settled below $70.00 Handle.
Alongside this, the Relative Strength Index (RSI) rose sharply from 47 to above 70 reflecting a fresh and strong uptrend momentum.
Just getting started? See our Beginners’ Guide for FX traders
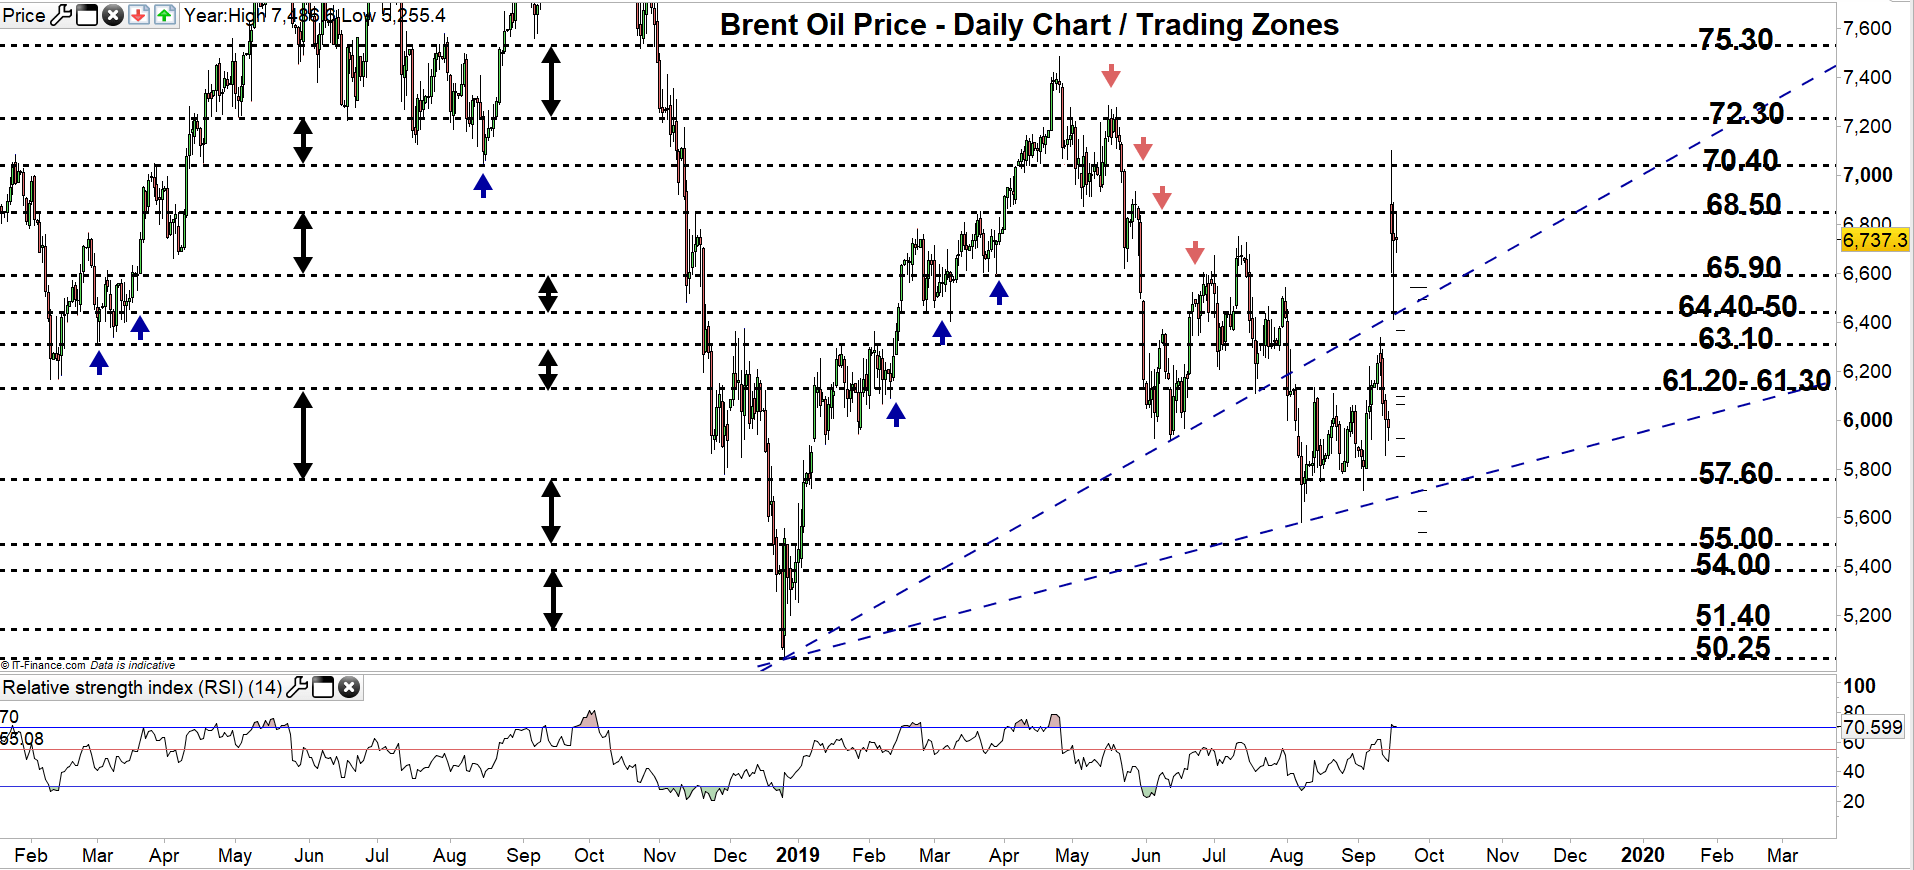
Brent Oil DAILY PRICE CHART (Jan 15, 2018 – SEP 17, 2019) Zoomed Out
Brent Oil DAILY PRICE CHART (June 11 – Sep 17, 2019) Zoomed In

From the daily chart, we notice yesterday crude oil opened with a gap, then slipped back and closed in a new trading zone $65.90 - $68.50.
Hence, a close above the high end of the zone may send Brent oil towards $70.40. Further close above this level could resume bullish price action towards $72.30. That said, buyers would need to pay a close attention to the resistance area with the levels marked on the chart (zoomed in).
In turn, any close below the low end of the zone might encourage sellers to press towards the vicinity of 64.50/40. Further close below this area may see the price trading even lower towards $63.10. However, the daily support area and levels with the weekly support level underscored on the chart should be monitored closely.
Having trouble with your trading strategy? Here’s the #1 Mistake That Traders Make
Brent Oil Four Hour PRICE CHART (Sep 1 – Sep 17, 2019) Zoomed In

Looking at the four-hour chart, we notice yesterday crude oil fluctuated sharply then stabilized below $68.00 handle.
Thus, a break above $69.34 could push the price for a test of yesterday’s High at $71.03. Although, the daily resistance level marked at $70.40 should be kept in focus. See the chart to know more about higher resistance levels Brent oil would encounter in a further bullish move.
On the flip-side, a break below $65.42 could press the price towards the vicinity of $64.50/40. Nonetheless, the weekly support levels underlined on the chart needs to be considered. See the chart to find out more about lower support levels Brent oil would face in a further bearish move.
Written By: Mahmoud Alkudsi
Please feel free to contact me on Twitter: @Malkudsi


