


Silver Price Forecast
- Silver outlook and chart.
- Silver price action.
Did you check our latest forecasts on USD and Gold ? Find out more for free from our Q3 forecasts for commodities and main currencies
Silver Price – Trading Higher
On Friday, Silver closed in the green for the third week in a row with 1.8% gain. The precious metal opened this week with a gap to the upside, reflecting the bullish outlook of the market.
Alongside this, the Relative Strength Index (RSI) crossed above 70 and remained in the overbought territory, indicating to buyer’s domination.
Having trouble with your trading strategy? Here’s the #1 Mistake That Traders Make
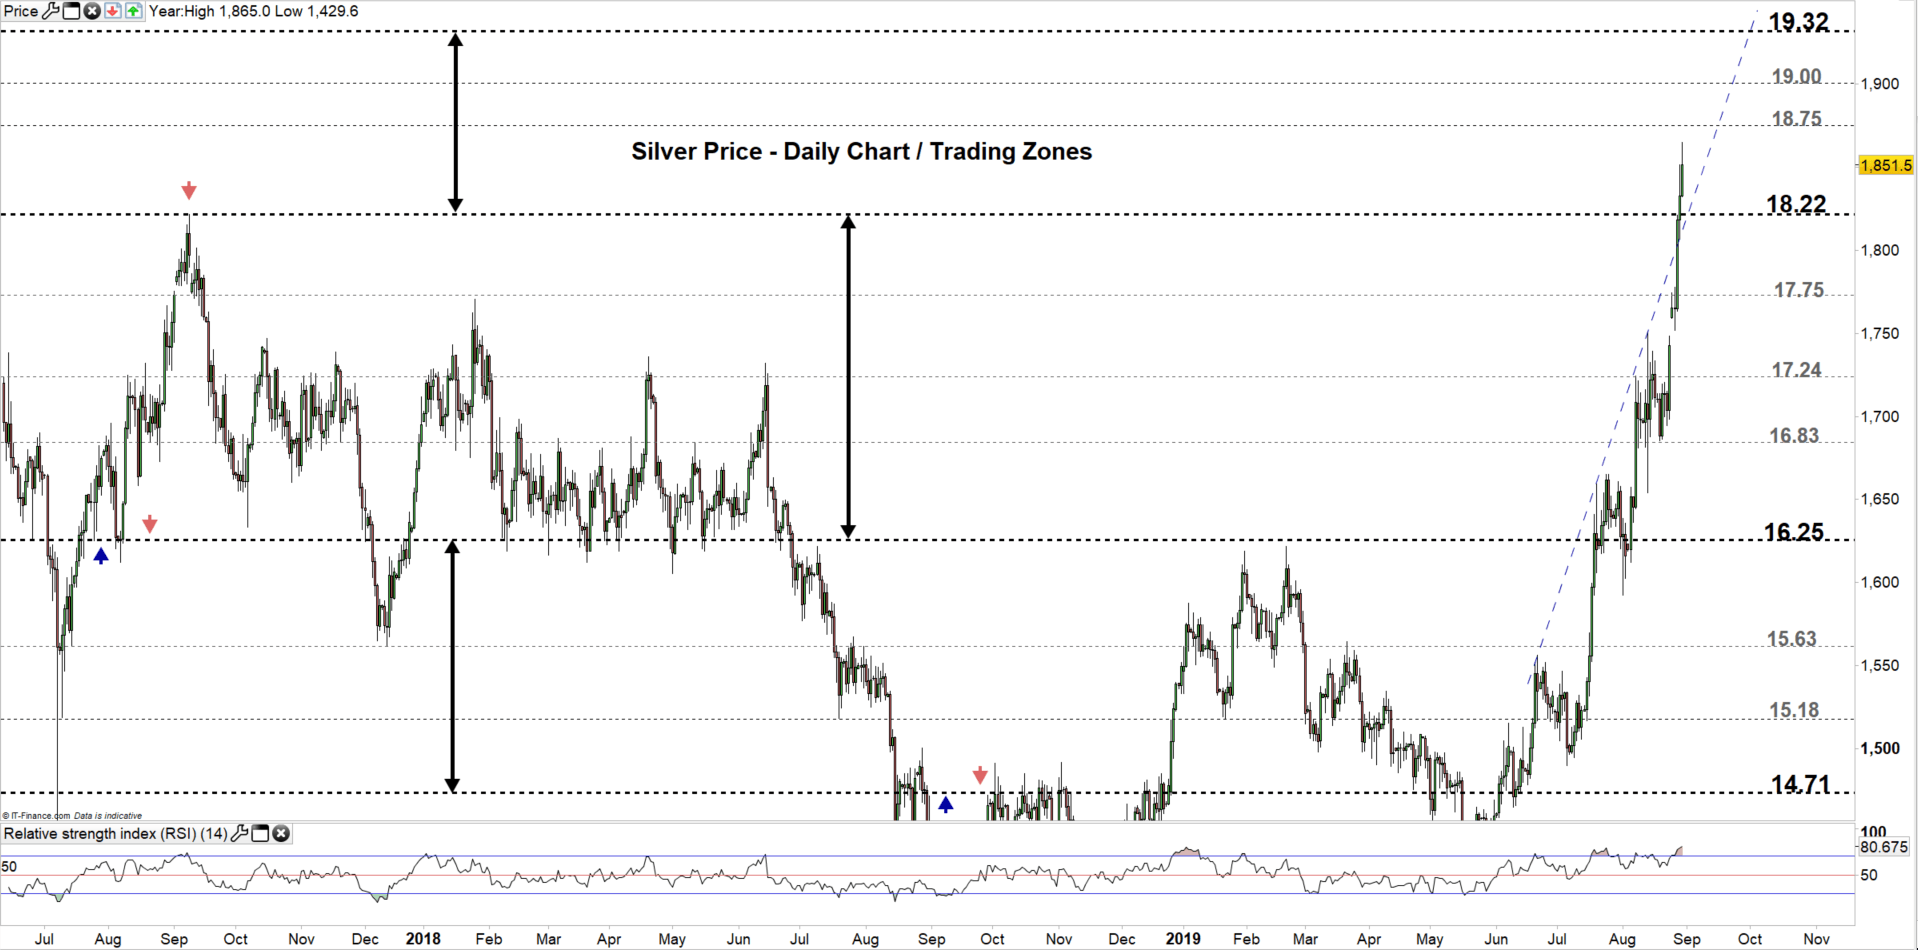
SiLver DAILY PRICE CHART (June 20, 2017 – Aug 29, 2019) Zoomed out
SiLver DAILY PRICE CHART (June 14 – AUG 29, 2019) Zoomed In
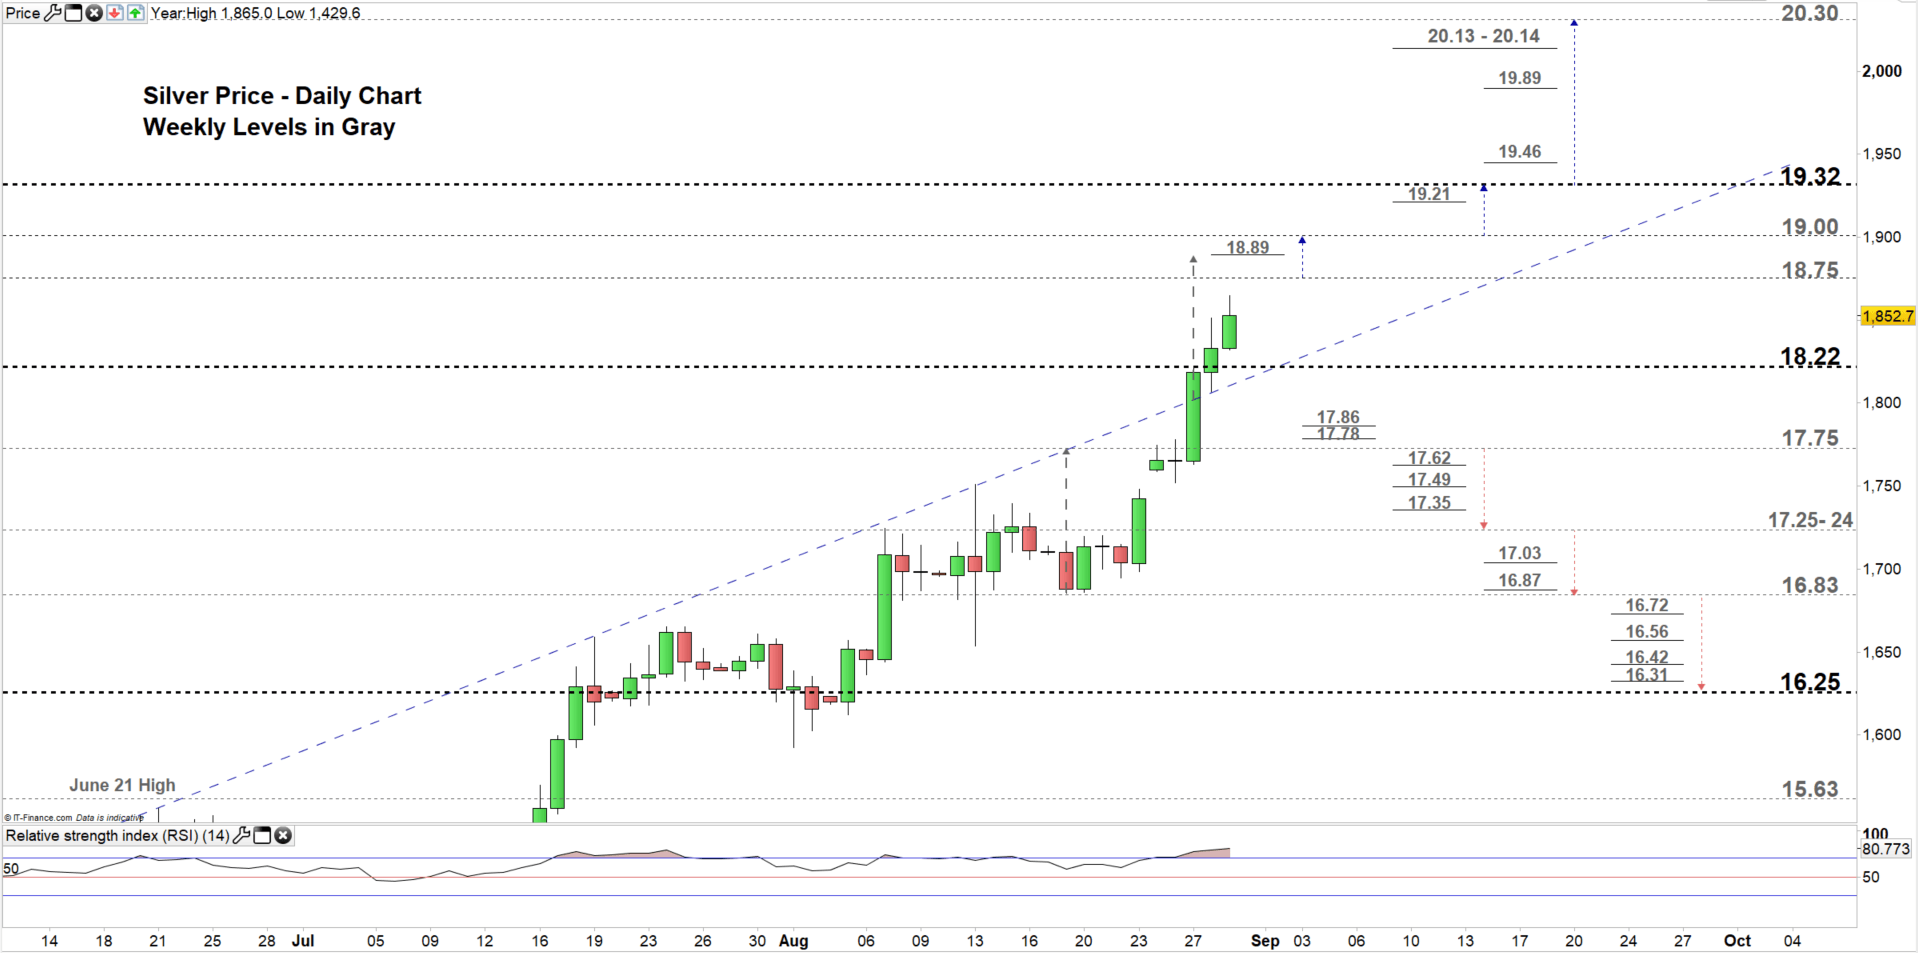
Looking at the daily chart we notice, on Tuesday the price broke above the uptrend line originated from the June 21 high at $15.56 eyeing a test of $18.89. yesterday, Silver rebounded from the uptrend then moved to a higher trading zone $18.22 – $18.75.
Thus, a close above the high end of the zone could push the price towards $19.00. Further close above this level might cause a rally towards $19.30. Nonetheless, the weekly resistance level underlined on the chart (zoomed in) would be worth monitoring.
On the flip-side, a close below the low end of the zone could send the price towards $17.75. However, the weekly support levels underscored on the chart need to be kept in focus. Further close below this level, could see Silver trading even lower towards the vicinity of $17.25-24. The weekly support levels marked on the chart need to be watched along the way.
Just getting started? See our Beginners’ Guide for FX traders
Silver Four-HOUR PRICE CHART (JuLY 4 – AUG 29, 2019)
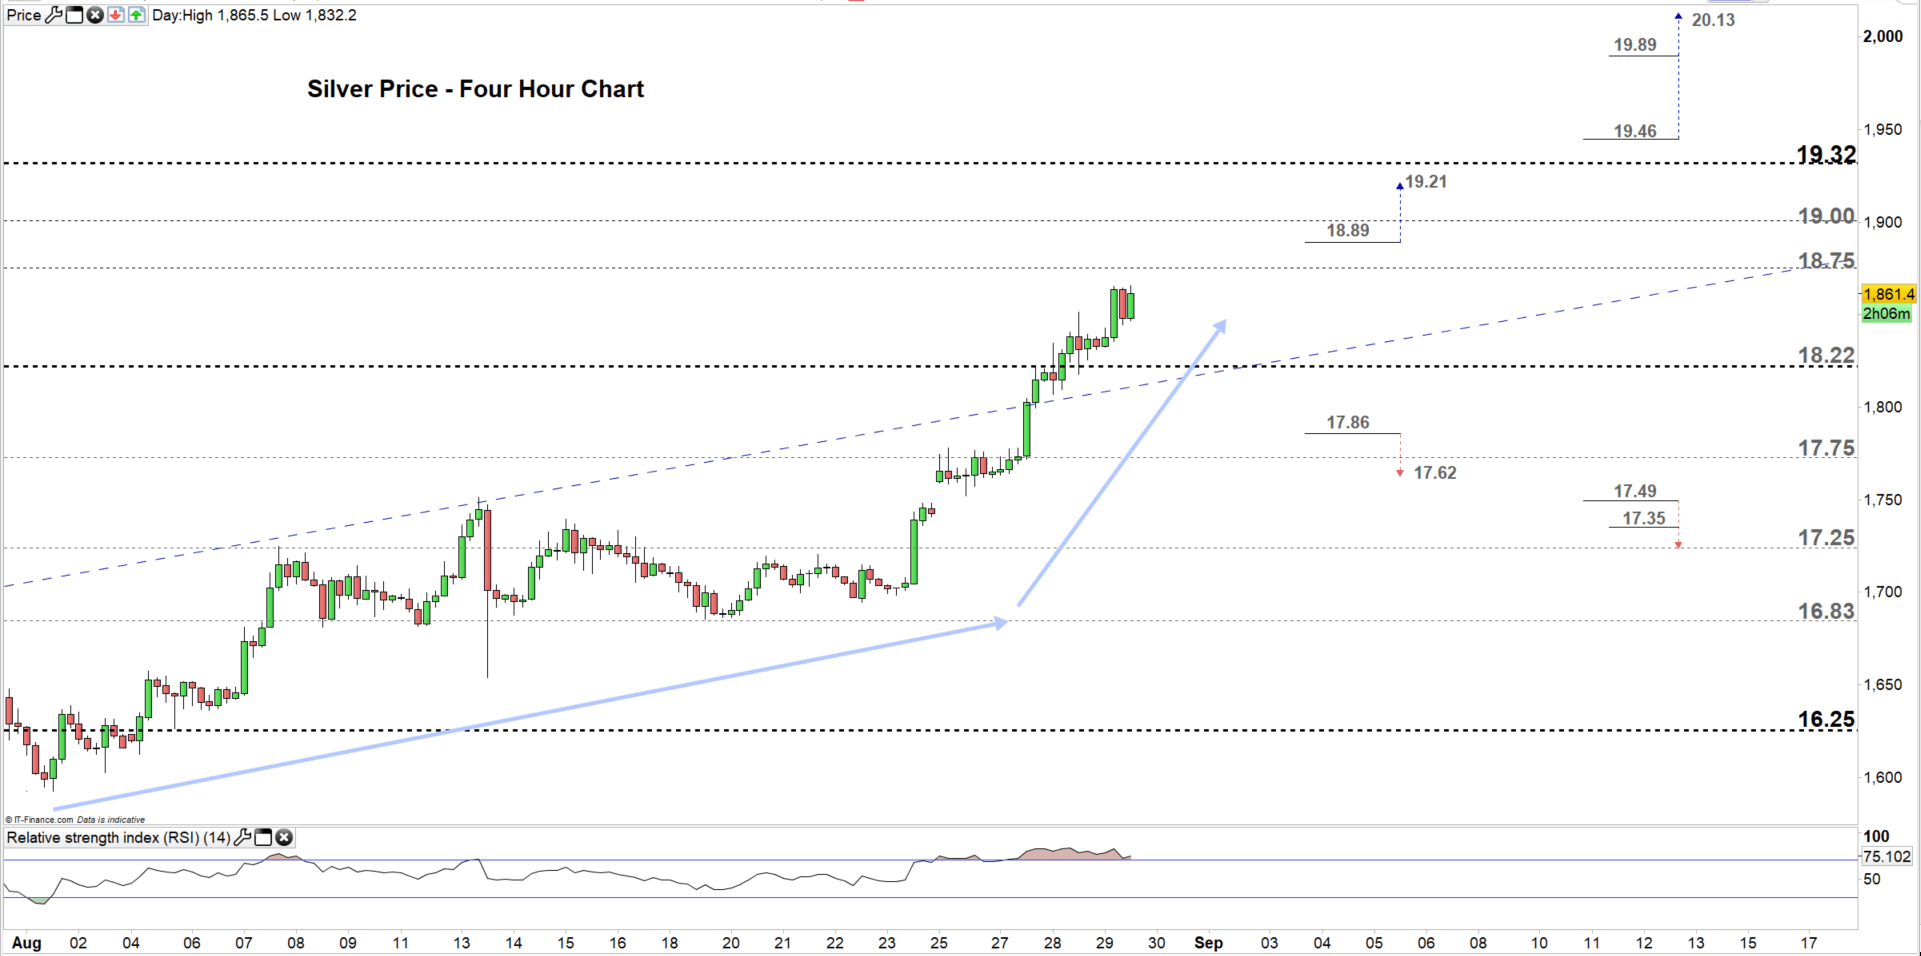
Looking at the four-hour chart we notice, since the start of August Silver started uptrend move creating higher highs with higher lows. At the start of the week uptrend has accelerated and moved in a sharper course, highlighting stronger bullish momentum.
Thus, a break above $18.89 could cause more bullishness towards $19.21. However, the weekly resistance level at $19.00 should be considered. See the chart to know more about higher resistance levels Sliver would encounter if the price rallies further.
On the other hand, If Silver breaks below $17.86 this could see the price falling towards $17.62. Although, the weekly support level at $17.75 Should be monitored. See the chart to find out more about higher support levels Silver would face if the price falls further.
Written By: Mahmoud Alkudsi
Please feel free to contact me on Twitter: @Malkudsi


