


USD/JPY Price Outlook
- USD/JPY charts and analysis.
- US Dollar price action against Japanese Yen.
Download for free our latest Q3 trading guides to help you build confidence when you trade on Gold, USD and other main FX and commodities markets.
USD/JPY- FROM HERO TO ZERO
Yesterday, USD/JPY rallied to 109.32 - its highest level in eight weeks. However, the price slumped rough 270 pips in 24 hours to test its lowest level in eight months.
Alongside this, the Relative Strength Index (RSI) yesterday fell sharply from 56 to 37 indicating to the strength of the downside momentum.
Just getting started? See our Beginners’ Guide for FX traders
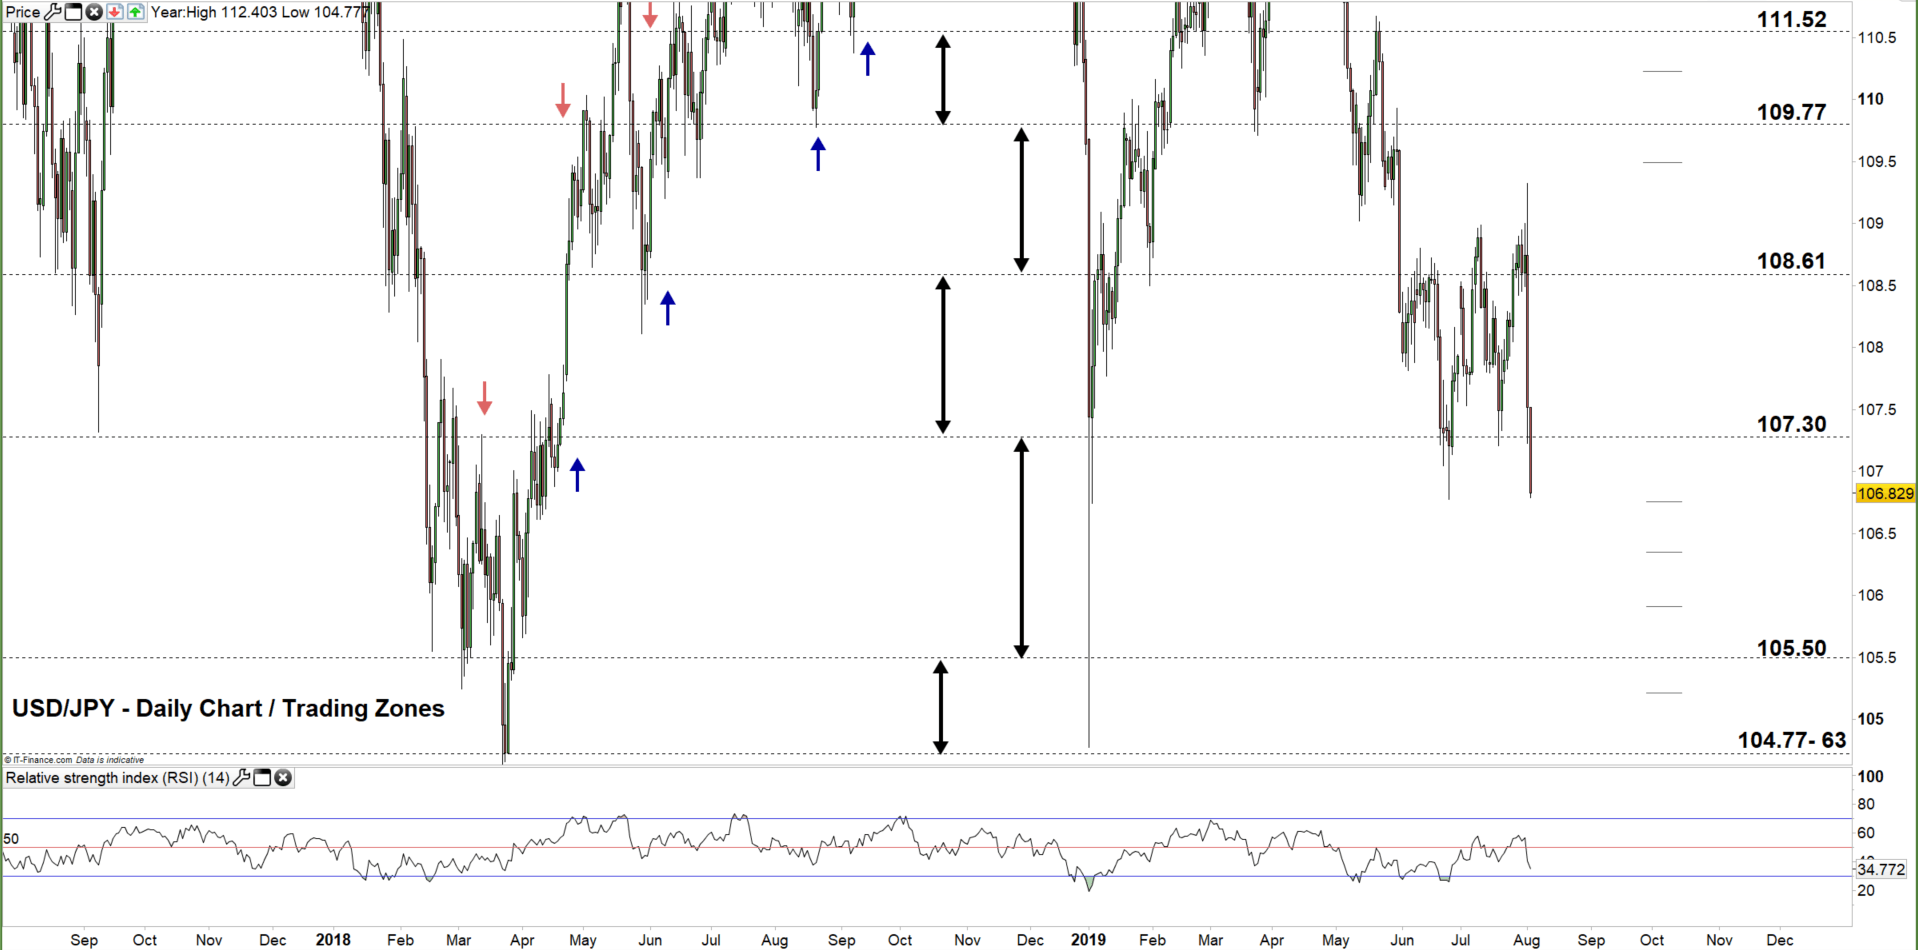
USD/JPY DAILY PRICE CHART (JULY 31, 2017 – AUG 2, 2019) Zoomed out
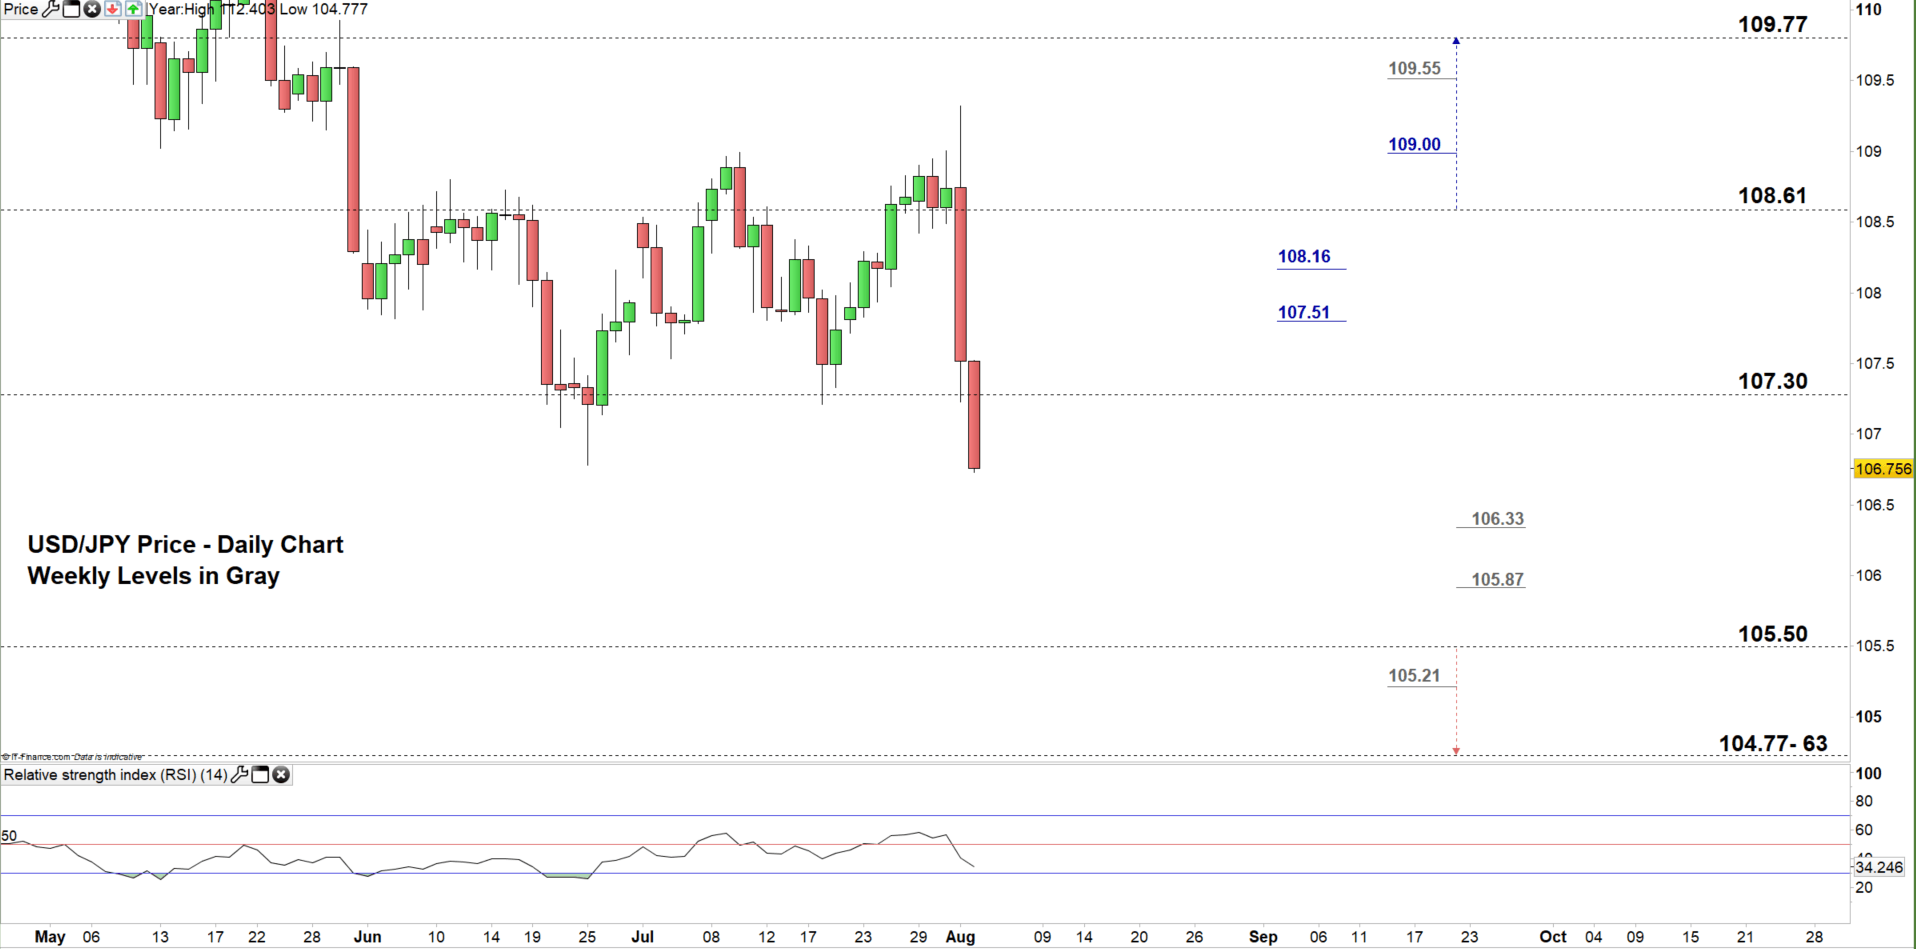
USD/JPY DAILY PRICE CHART (MAY 1 – AUG 2, 2019) Zoomed in
Looking at the daily chart, we notice yesterday USD/JPY spiked then slipped back towards the old trading zone 107.30 – 108.61.
Therefore, a close below the low end of this zone may press the price towards 105.50. Although, the weekly support levels underlined on the chart (zoomed in) should be watched closely. See the chart to know more about the lower trading zone with the weekly support level sellers would face in a further bearish scenario.
On the other hand, any close above the low end could push the price towards the high end. Nonetheless, the daily resistance levels marked on the chart need to be considered. Look at the chat for to find out more about the higher trading zone with the daily and weekly resistance levels buyers would encounter in a further bullish scenario.
Having trouble with your trading strategy? Here’s the #1 Mistake That Traders Make
USD/JPY PRICE four hour CHART (JuLY 15 – AUG 2, 2019)

Looking at the four-hour chart we notice, today USD/JPY has continued its downside move, breaking below the low end of the aforementioned trading zone. Its also worth noting that USD/JPY rallied today however, rebounded nearby the low end of the zone, indicating to the bearish outlook of the pair.
Therefore, a break below 106.33 could send the price towards 105.50. However, the weekly support level underscored on the chart should be kept in focus.
On the flipside, a break above 107.51 may push the price towards the high end of the aforementioned trading zone. Although, the daily resistance level marked on the chart would be worth monitoring.
Written By: Mahmoud Alkudsi
Please feel free to contact me on Twitter: @Malkudsi


