


Copper Price Forecast
- Copper charts and analysis.
- Copper price may resume its bearish momentum.
Did we get it right with our various forecasts? Find out more for free from our Q2 USD and main currencies forecasts
Copper Price – Bulls Hesitation
On June 11, Copper’s attempted to re-coup recent heavy losses. The price rallied towards $5,965 then declined and closed with a bearish Doji pattern, emphasizing the bull’s hesitation to push even higher.
Alongside, the Relative Strength Index (RSI) remained below 50 showing lack of momentum to kick start an upwards trend.
Having trouble with your trading strategy? Here’s the #1 Mistake That Traders Make
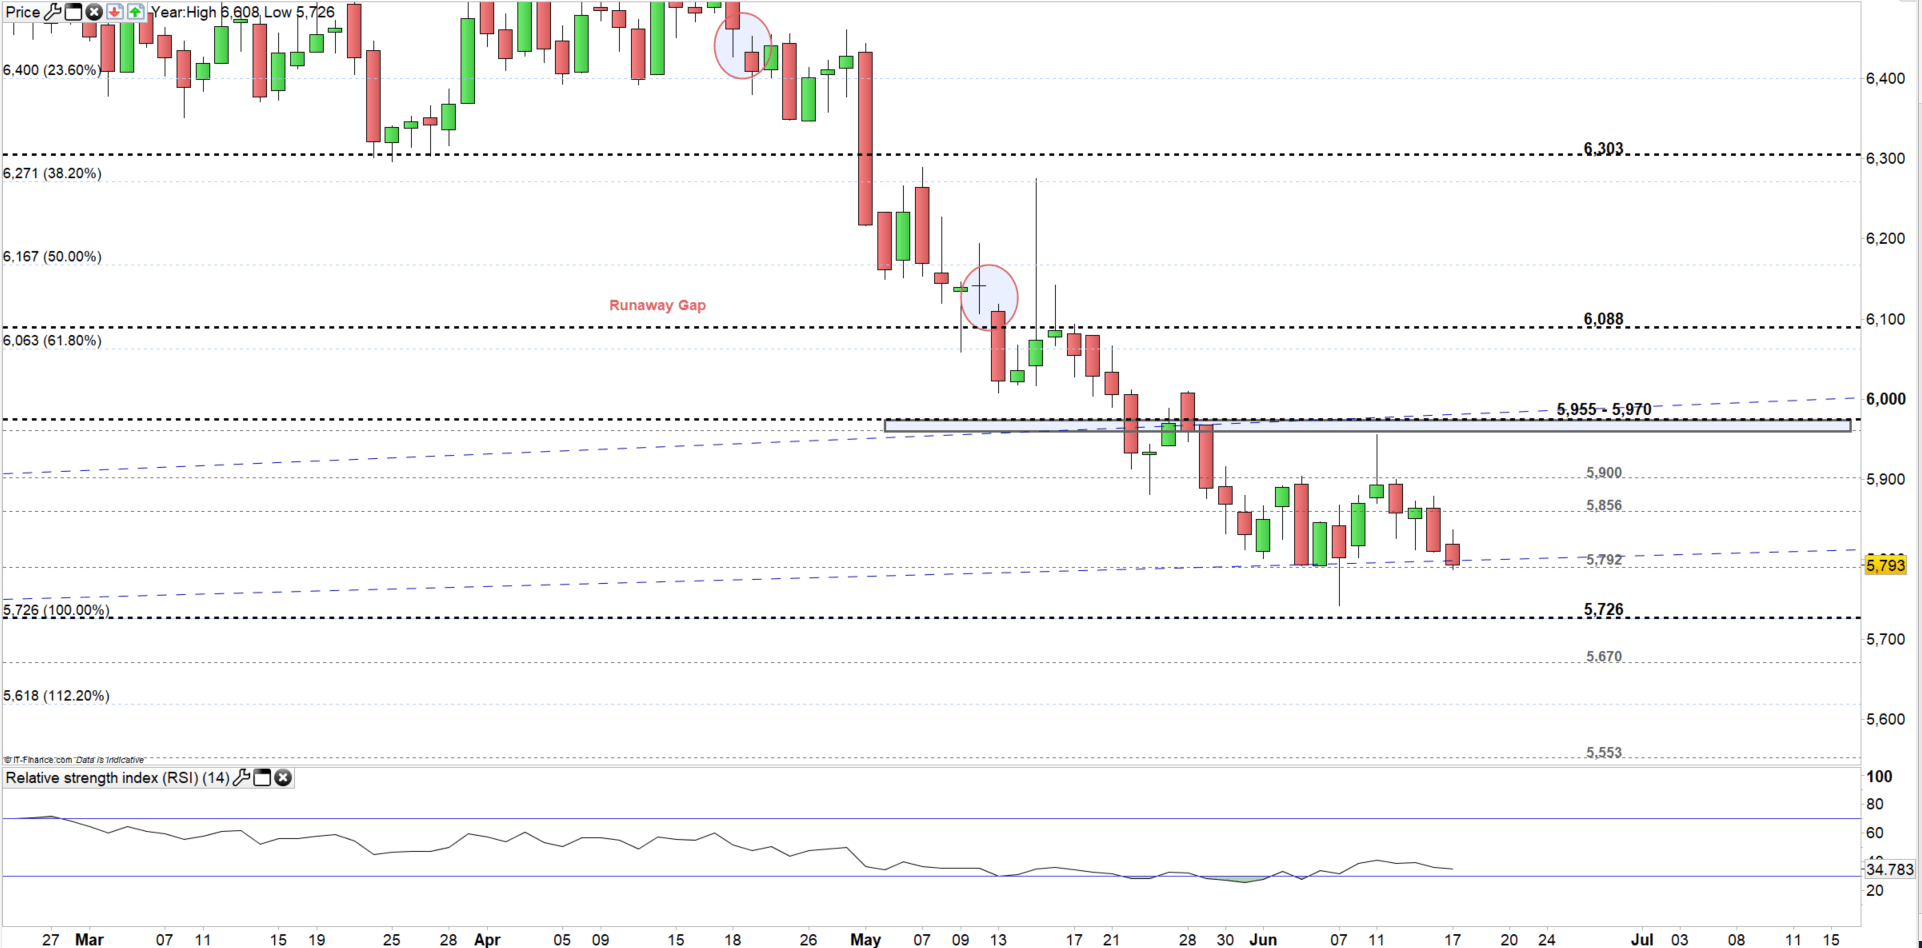
Copper DAILY PRICE CHART (FEB 24, 2019 – JUn 17, 2019) Zoomed In
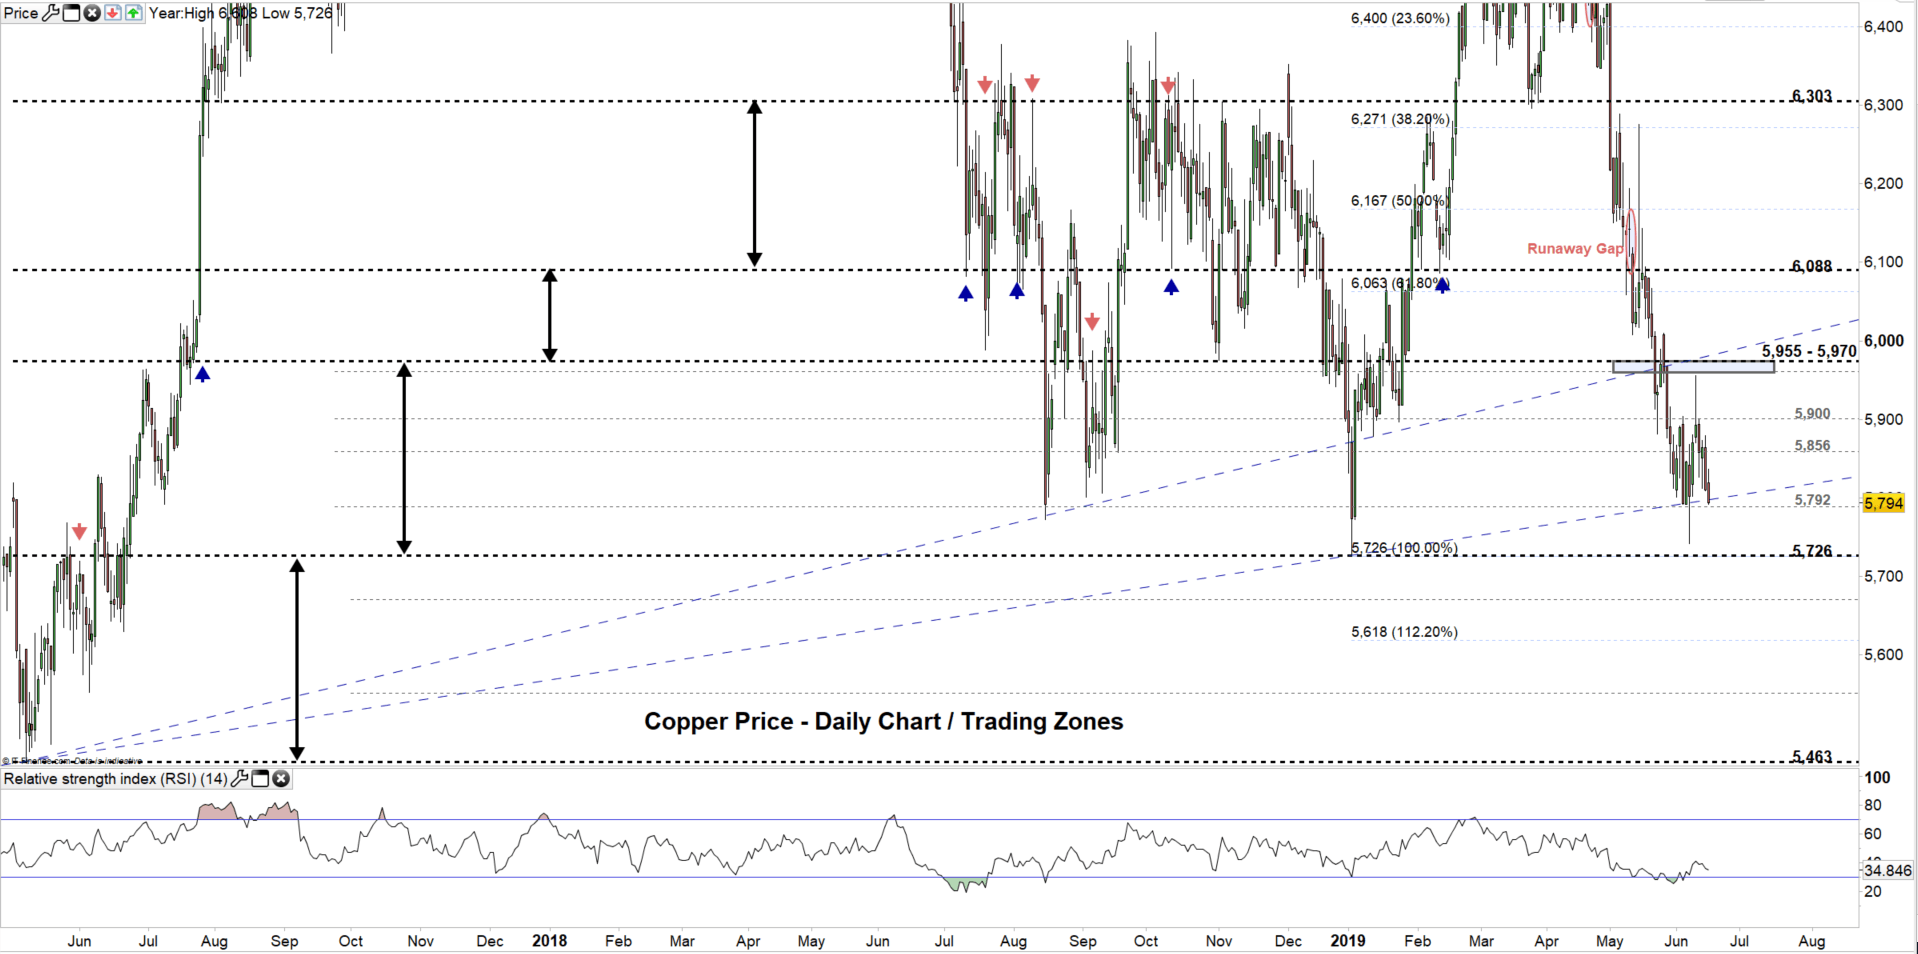
Copper DAILY PRICE CHART (Apr 26, 2017 – JUN 17, 2019) Zoomed OUT
Looking at the daily chart we notice Copper’s U turn on June 11 hinting towards the low end of the current trading zone ($5,726 - $5,970). Hence, a close below this level could send Copper towards 112.20% Fibonacci extension at $5,618. However, the weekly support at $5,670 would be worth monitoring.
In turn, a close above $5,856 suggests Copper might rally towards the June 11 high at 5,956. Although, the weekly resistance at $5,900 need to be kept in focus.
Just getting started? See our Beginners’ Guide for FX traders
Copper Four-HOUR PRICE CHART (May 30, 2019- JUN 17, 2019)
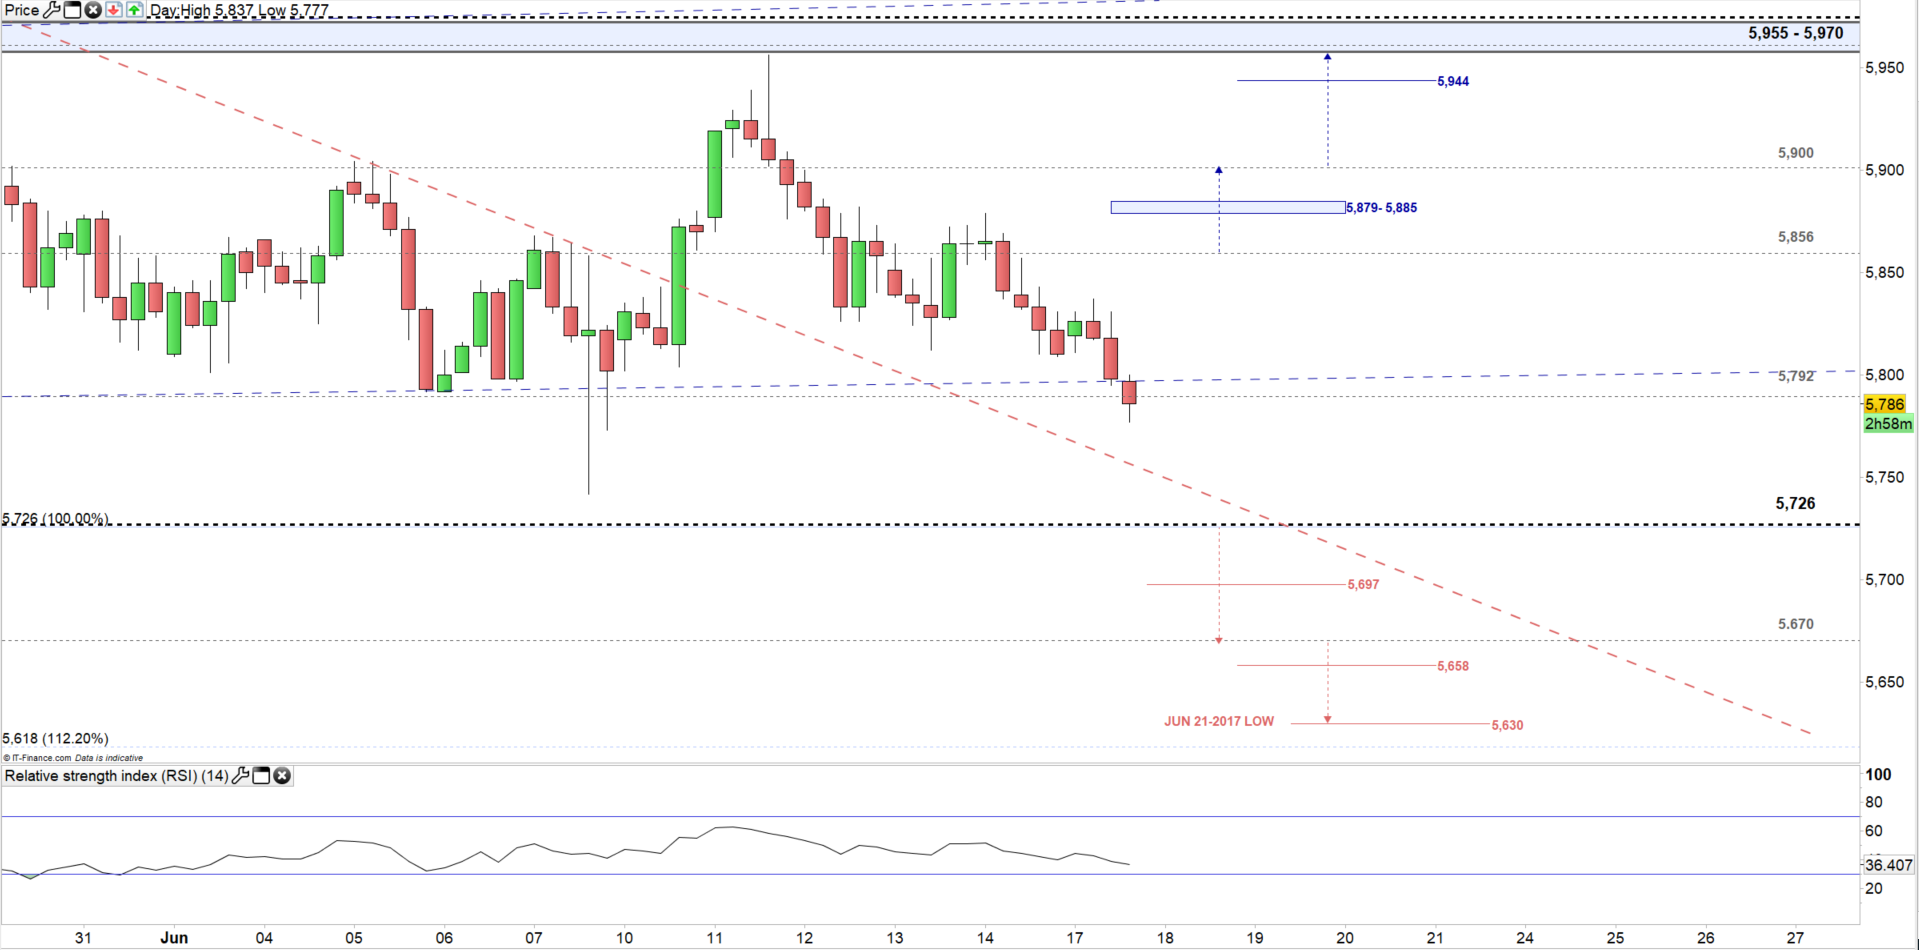
Looking at the four-hour chart, we notice Copper shifted course on June 11 after creating a higher high at $5,956. Since then the price pointed lower creating lower high’s and lower lows. Therefore, a break below $5,726 will lead the price to print its lowest level in nearly two years and may send it towards $5,670. Although, the weekly support at $5,697 needs to be monitored. See the chart for key technical levels if the selloff continue below $5,670.
On the flipside, if Copper rallies above $5,856 it could continue towards $5.900. However, the weekly resistance located in the vicinity $5,879/85 should be watched closely. See the chart for key levels if the rally continues above $5,885.
Written By: Mahmoud Alkudsi
Please feel free to contact me on Twitter: @Malkudsi


