


USD/CAD Price Outlook - Looking for a Break Below 1.3410?
- US and Canadian Data Next Week Likely to Drive Price Action
- USD/CAD Chart Range Break Out and Potential Scenarios
- See the Q2 USD and CAD forecast to see what is likely to drive price action through mid-year
- View the DailyFX Economic Calendar for a comprehensive look at all next week’s data releases
USD/CAD Daily Price Chart (Oct 2018 – May 03, 2019)

Price Action Around 1.3457 - What Does It Mean if We Trade Below 1.3410?
Since March 7th USD/CAD has been stuck in a sideways trading pattern between 1.3457 and 1.3286. USD/CAD price failed to close below this trading range 5 times between March 19thand April 17th suppressing bearish momentum.
The most prominent development was on April 24th when prices broke above 1.3457 and continued rallying to print at 1.3521 – its highest level in nearly 4 months. However, the price failed to close above 1.3516 twice, which opened the door for the currency pair to subsequently swing lower.
On April 29th USD/CAD closed below 1.3457 and returned to its old trading range before dropping over the next 2 days to 1.3377 where it rebounded on May 1st before closing above 1.3457 on May 2nd (see chart above).
To Summarize: during this past week’s session, USD/CAD tested 1.3457 everyday with spot prices closing both above and below this level. A bearish bias would be more probable if prices close today below 1.3457 with the most significant downward support likely at 1.3410. Support at 1.3426 is worth monitoring, while USD/CAD could eye 1.3378 if prices close below 1.3410 after first taking into consideration support levels at 1.3400 and 1.3389.
What if USD/CAD prices close above 1.3457 this week?
Bullish sentiment might suggest a positive bias towards 1.3516. A series of resistance levels could be targeted along the way, however, such as the 1.3469, 1.3477, 1.3493 and 1.3509 prices.
USD/CAD 2 Hours Price Chart (May02, 2019)
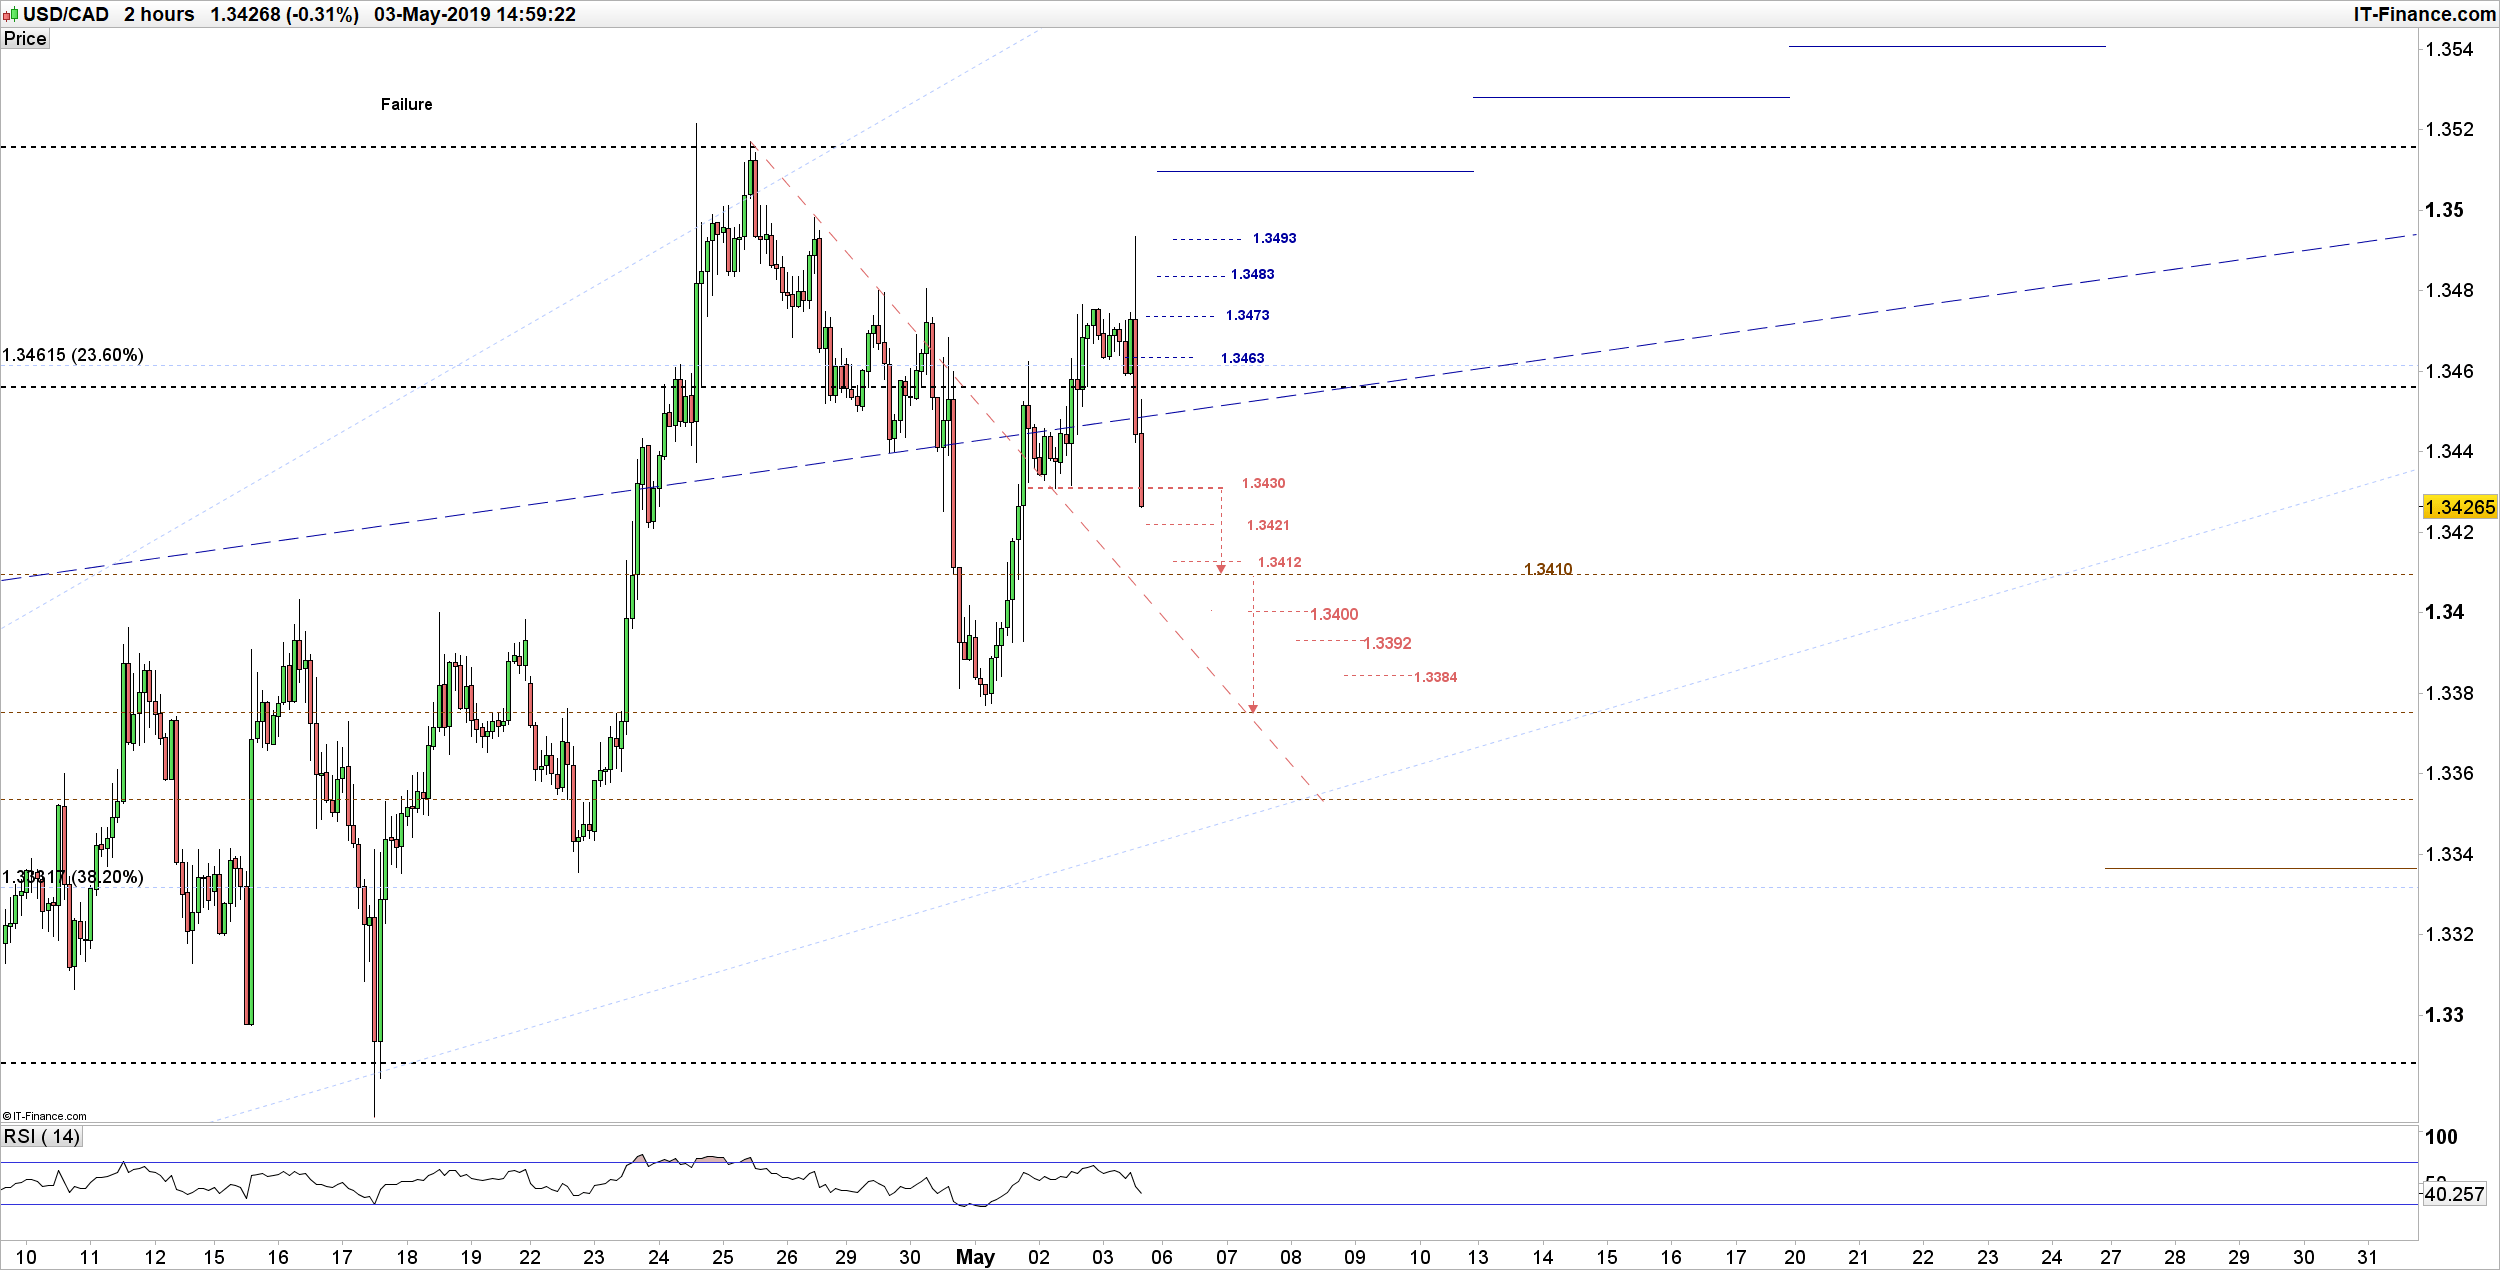
Bearish Developments
We noticed that bearish momentum emerged after USD/CAD failed at 1.3493 near the 2-hour candle at 1.3472. Additional negative momentum developed when the price broke below 1.3430, while the Relative Strength Index dropped sharply from 61 to 39 which fuelled additional bearish momentum.
If prices break and close below 1.3410, such development suggests USD/CAD might swing lower towards 1.3375. However, a series of support levels are worth watching at 1.3400, 1.3392 and 1.3384 first.
Written By: Mahmoud Alkudsi
Please feel free to contact me on Twitter: @Malkudsi
Having trouble with your trading strategy? Here’s the #1 mistake that traders make
Just getting started? See our beginners’ guide for FX traders


