


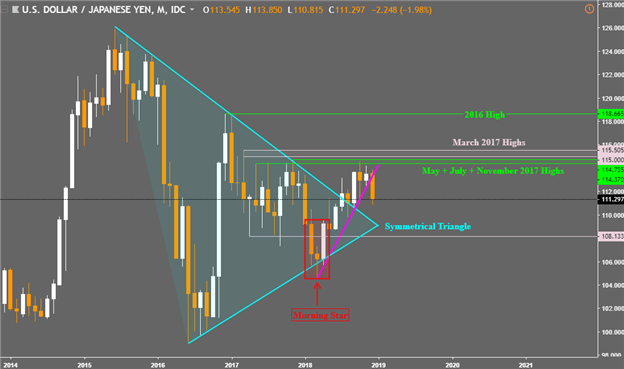
Taking a closer look on the monthly chart below, prices failed to push above the horizontal range of resistance between 114.37 and 114.73 outlined in the Q4 2018 forecast. This area is created by combining the highs achieved in May, July and November 2017. This leaves USD/JPY facing the threat of reversing upside progress achieved over most of last year.
USD/JPY Price Chart: Monthly Timeframe (December 2013 to December 2018)
--- Written by Daniel Dubrovsky, Junior Currency Analyst


