


USD, JPY, US Dollar, Japanese Yen, USD/JPY - Technical Outlook:
- USD/JPY is running into a major hurdle
- What is the short-term and medium-term outlook?
- What are the key levels to watch?

USD/JPY SHORT-TERM TECHNICAL FORECAST –SLIGHTLY BULLISH
USD/JPY is about to encounter one of the most significant resistance areas it has since its major breakout experienced in April following which the uptrend accelerated.
It is nearing the 1998 high of 147.65, coinciding with the 200-quarter moving average and the upper edge of a rising channel from 2012 (see chart). To be sure, there is no sign of reversal of the uptrend or even any imminent sign of a retreat – the pair made a new daily, weekly, monthly, quarterly and yearly high on Thursday. For any consolation/retreat to take place, at minimum, price needs to stop making new highs. That doesn’t seem to be the case for USD/JPY, at least not yet. Hence the path of least resistance remains up for now.
USD/JPY Quarterly Chart
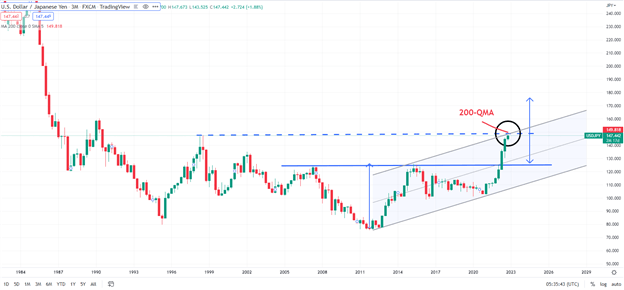
Chart Created Using TradingView
Having said that, it is also apparent that the multi-month uptrend is showing some signs of fatigue on - that is, negative divergence (rising price associated with a stalling or decline in momentum) – on the daily and weekly charts. As with all such instances, divergences may be necessary but not sufficient conditions to ensure a change in a trend. Moreover, divergences don’t provide a sense of timing of such a turn. Unless confirmed by price, divergences can only explain part of the story.
As an early sign that the rally is indeed faltering in the short term, USD/JPY would need to break below the September highs of 145-146. That would put the divergences into play. Any further setback could push USD/JPY towards the September intervention low of 140.34. USD/JPY would need to decisively break below the 89-day moving average, near the July high of 139.40, for the broader uptrend to start cracking. As the chart below shows, the last time USD/JPY was decisively below the average was in early 2021 before the surge began.
USD/JPYDaily Chart
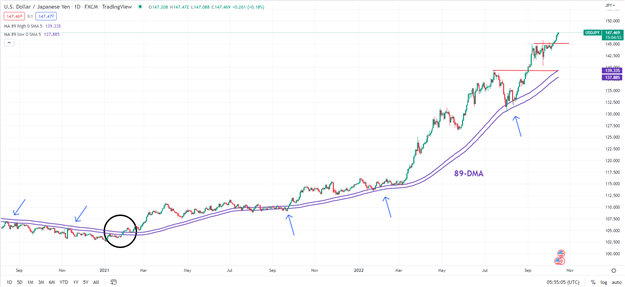
Chart Created Using TradingView
The upshot of the above is that while the likelihood is increasing of a pause in the USD/JPY’s rally, how lasting or deep it will be remains a question. If it is a quick, short, and shallow retracement, like the reaction to the recent Bank of Japan intervention, then it may not significant enough to be captured enough on the quarterly chart, or even meaningful enough to derail the broader uptrend. That would be strong sign that the major reverse head & shoulders pattern triggered this year is still in play – the price objective of the pattern points to further upside in USD/JPY in coming months/years.
--- Written by Manish Jaradi, Strategist for DailyFX.com


