


US equities are approaching year-to-date lows and there are no signs of a reversal. Using the three benchmark indices, the Dow Jones Industrial Average (DJIA), the S&P 500 index and the Nasdaq Composite index, this section attempts to address the following questions: How advanced are we in the current downtrend? How much more downside could there be? Importantly, what could be the trend over the next few months?
But first, let us set some context for the 2022 decline.
The Dow Jones Industrial Average
This year’s decline is a ‘normalization’ process from extreme overbought conditions. At the start of the year, the gap between prices and the 200-month moving average was the widest on record (MMA; see chart).
Dow Jones Monthly Chart
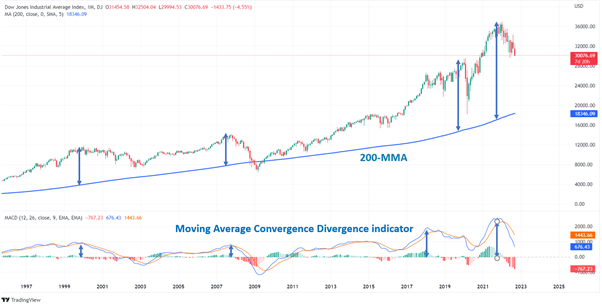
Chart created with TradingView
Long-term moving averages tend to act as proxies for broader trends. Prices tend to mean revert to them from extreme overbought or oversold conditions, especially when some of the drivers of overextension change/reverse. Going by the distance between the 200-MMA and the index, the dot-com crash, Great Financial Crisis (GFC) and Covid-19 selloffs were all preceded by extreme overbought conditions.
This doesn’t imply that the index must revert towards the 200-MMA – it could well go sideways, while the 200-MMA catches up. In a way, the MACD indicator can serve as a guide to how stretched the trend was at the start of the year, although quantifying the extent of optimism/ pessimism can be tricky given it is an unbounded indicator (see chart above).
S&P 500 index
For the S&P 500, in terms of potential downside, the 200-week moving average (WMA; now at about 3,585) is likely to offer a quite strong initial cushion. There is potent support at the pre-Covid high of 3,394. Given the sharply ascending slope of the 200-WMA, the probability of the index holding the 3,394-3,585 area and rebounding from around there is high.
S&P 500 Monthly Chart
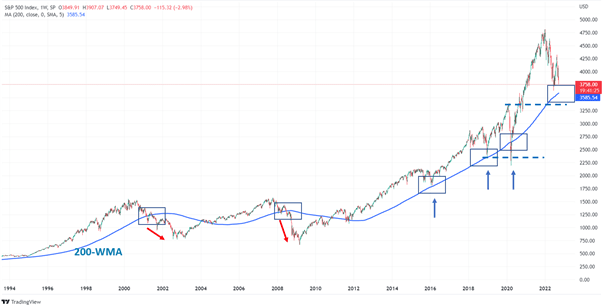
Chart created with TradingView
That’s because, in the past, the slope of the 200-WMA and the average itself has provided a guide in cases of prolonged downtrends. The index tends to rebound from near the moving average and when it is ascending (chart’s blue annotations). However, uptrend reversals are often preceded by a break below the moving average associated with a flattening of the 200-WMA (chart’s red annotations). In a way, the long-term average’s flatness can be interpreted as trend ‘exhaustion’.
Nasdaq Composite index
To get a sense of how advanced the current downtrend is, the Relative Strength Index (RSI) can serve as a guide. Using two previous instances, dot-com and GFC episodes, as they were similar to the 2022 decline in terms of their duration, the probability is high that US indices are in the advanced stages of the decline (see chart). The index rebounded when the 14-month RSI was near 30. Currently, the RSI is around 42.
Even if the index were to rebound, it would be premature to conclude ‘trending’ conditions like 2020-2021 as the Plus and Minus Directional Movement Index (DMI) on the monthly chart are both below 25, suggesting range-bound conditions. Within the range, there could be a slight downward bias as the Minus DMI is above Plus DMI.
Nasdaq Composite Monthly Chart
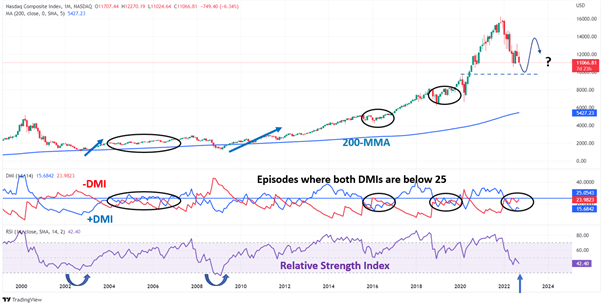
Chart created with TradingView


