


Gold, XAU/USD, Silver, XAG/USD - Technical Forecast for the Week Ahead:
- Gold prices leveled following persistent losses in August
- Meanwhile, Silver is making a more aggressive upside push
- What are key technical levels to watch in the week ahead?

Gold Technical Forecast – Neutral
Gold prices leveled this past week following persistent losses throughout August. Prices reinforced the 1681 – 1696 support zone and left behind a Bullish Engulfing candlestick pattern. The yellow metal subsequently found cautious upside follow-through as prices approached the 38.2% Fibonacci extension level at 1732.
Not far above is the 20-day Simple Moving Average (SMA), which could reinstate the downside focus. If it doesn’t, the long-term falling trendline from March will then come into focus. To overturn the downside bias, confirming a breakout above this trendline will likely be key. Until then, there is room for gold to push higher in the interim without necessarily overturning the downside focus since earlier this year.
If that is the case, keep a close eye on the 100-day SMA as the next key level. In the event of a turn lower, keep a close eye on the July low. A confirmatory breakout would open the door to testing the lowest price since 2021. Subsequent losses would expose the 78.6% and 100% Fibonacci extensions at 1651 and 1609 respectively.

XAU/USD Daily Chart
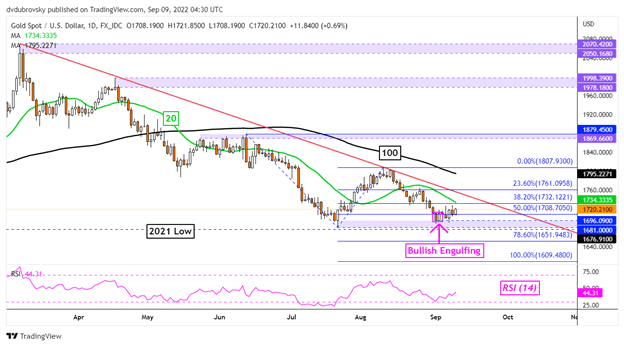
Chart Created Using TradingView
Silver Technical Forecast – Slightly Bullish
Silver prices aimed higher this past week after a false breakout under the 18.148 – 18.410 support zone. XAG/USD subsequently confirmed a breakout above the near-term falling trendline from the middle of August. That has opened the door to further gains as the 50-day SMA nears. This line is also closely aligned with the 38.2% Fibonacci extension at 19.204.
Pushing higher would then expose the 23.6% level at 19.841 before the August high at 20.871 comes into play. In the event of a turn lower, keep a close eye on the support zone mentioned earlier. Further losses subsequently expose the 78.6% extension at 17.44 before the 100% level at 16.507 comes into play.

XAG/USD Daily Chart
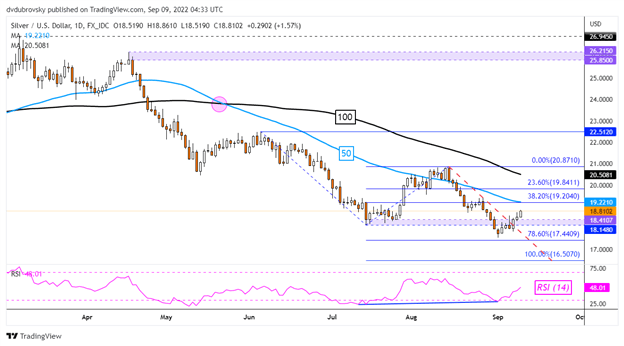
Chart Created Using TradingView
--- Written by Daniel Dubrovsky, Strategist for DailyFX.com
To contact Daniel, use the comments section below or @ddubrovskyFX on Twitter


