


Dollar Yen Technical Outlook: Bearish
- USD/JPY RSI points lower after two consecutive weeks of losses
- DollarYen potential pullback or reversal?
- Price action falls below the 50 SMA (moving average), 130.00 – 136.00 remains key.

USD/JPY Extends Losses, Weekly RSI Points Lower
USD/JPY has continued to move lower as the narrowing of yield differentials and softer economic data limits Dollar strength.
With a hawkish Federal Reserve and aggressive rate hikes fueling the steep rally, the major currency pair has experienced two weeks of consecutive losses after reaching a fresh 24 year high in mid-July.
After the formation of a golden cross (50 MA crosses above the 200 MA) on the weekly time-frame, bulls continued to drive price action higher before running into a wall of resistance just below the 140.00 psychological handle.
While this level holds as critical resistance for both the short and longer-term move, the weekly RSI (Relative Strength Index) has retreated from overbought territory with the 132.5 mark (weekly low) forming as support.
USD/JPY Weekly Chart
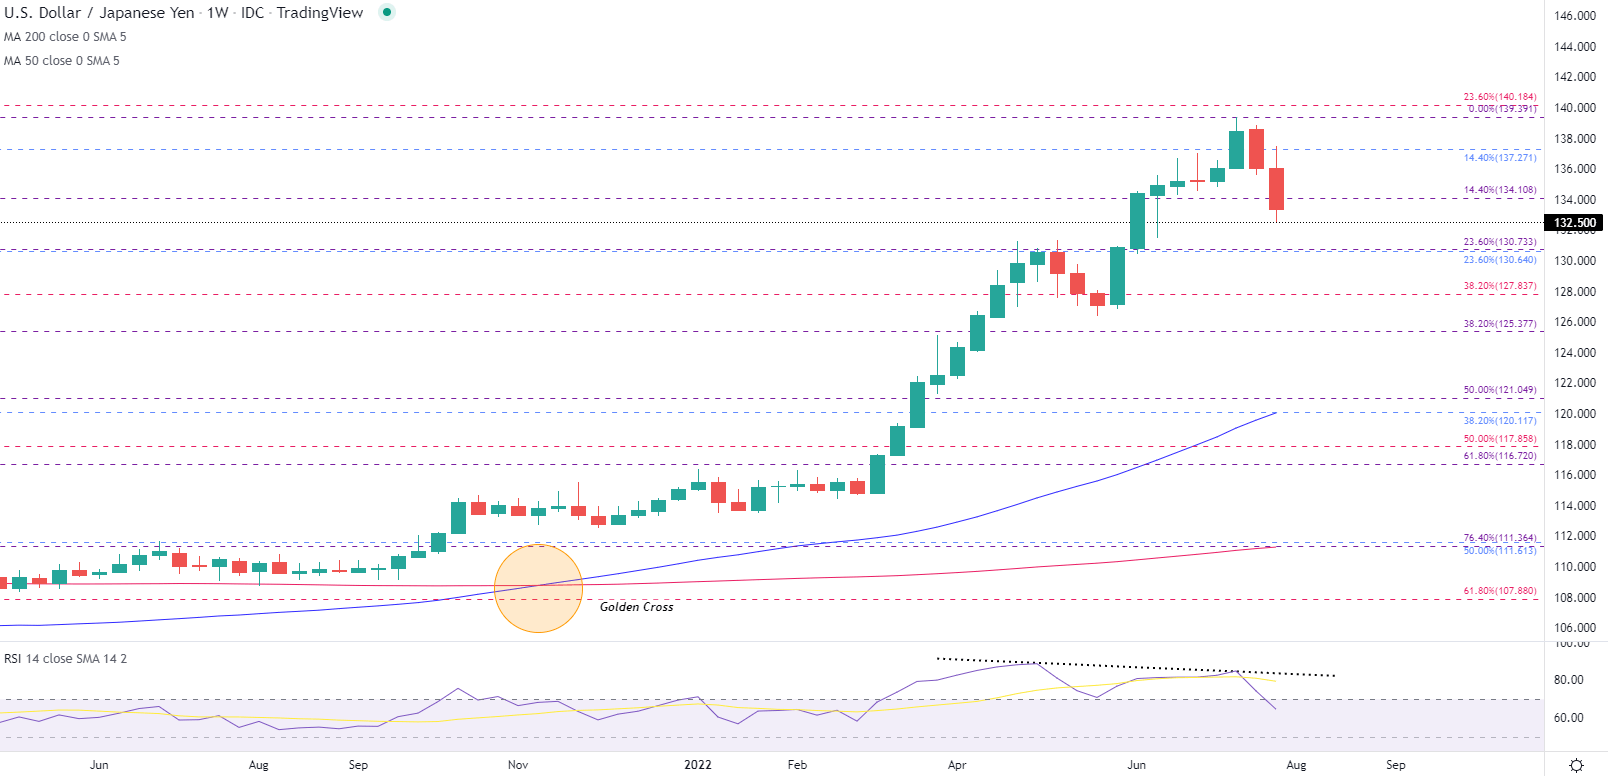
Chart prepared by Tammy Da Costa using TradingView
However, the daily chart below highlights the manner in which the 50-day MA (moving average) has provided additional support for the uptrend. With sellers temporarily driving lower, the a break of 132.00 could see an increase in the momentum of the downtrend with the next level of support holding at the 38.2% Fib of 127.84.

USD/JPY Daily Chart
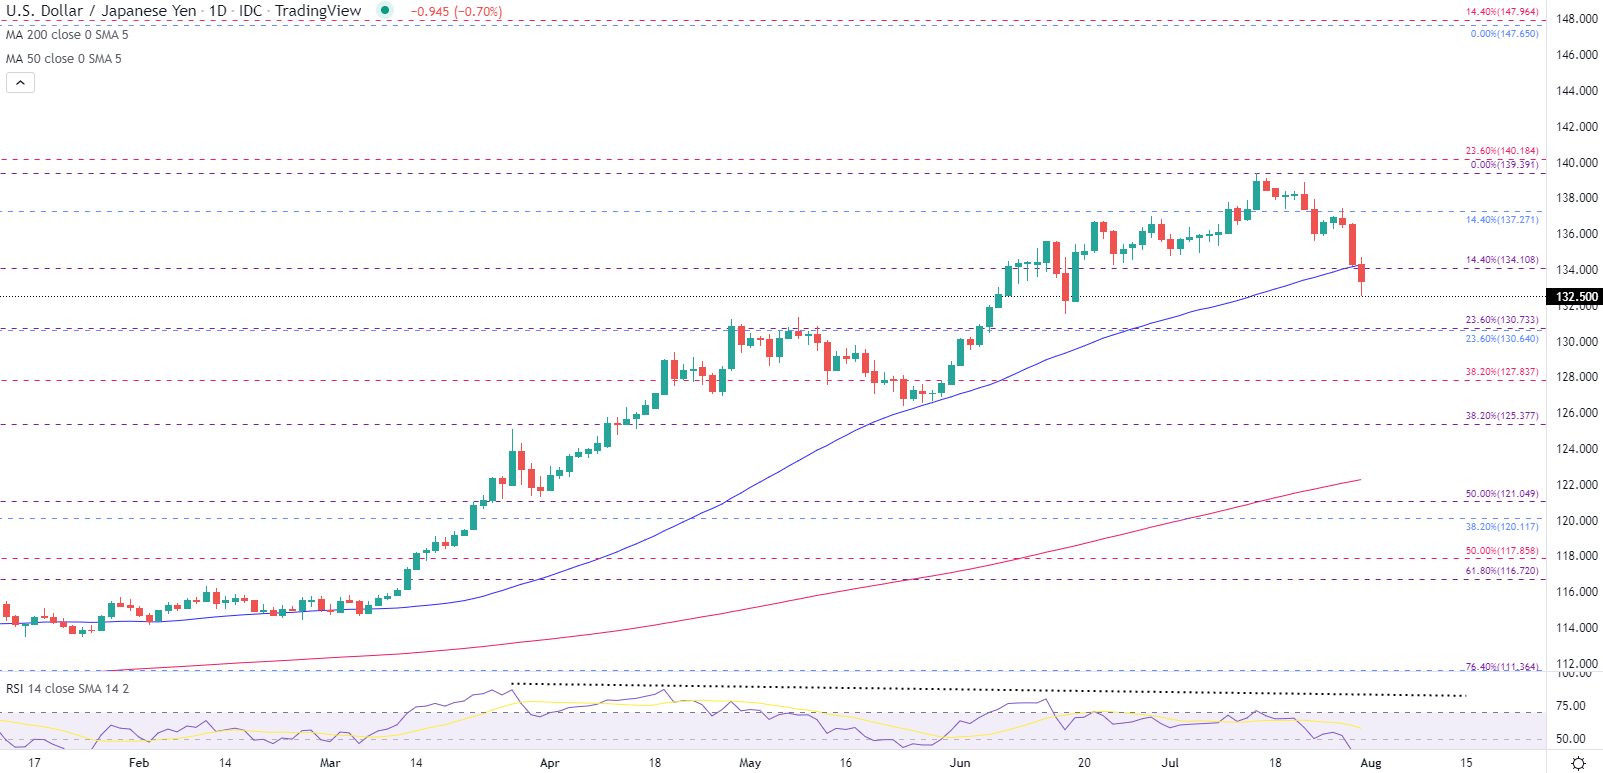
Chart prepared by Tammy Da Costa using TradingView
But, if bears fail to gain traction, a hold above 132.5 and above the 50-day MA (134.26) could allow for a retest of 137.27 and towards that 140 spot.
--- Written by Tammy Da Costa, Analyst for DailyFX.com
Contact and follow Tammy on Twitter: @Tams707


