


Crude Oil Price Analysis: Bullish
- Oil prices remain confined by key technical levels
- US Crude (WTI) wrestles with Fibonacci as bulls and bears look for a breakout
- Price action eases after a steep decline, oil rebounds off of support

Since the onset of the Covid-19 pandemic, fundamental factors have undoubtedly been the primary driver of commodity prices with Crude Oil being no exception.
Although supply constraints, war and demand disruptions have contributed to the rapid surge in energy prices, technical levels have played an additional role in fueling price action which currently remains in favor of the bullish move.
Looking back, it is almost surreal to think that in April 2020 an oversupply of oil and limited capacity forced many producers to pay for storage, driving oil futures into negative territory. In response to the historical shock, OPEC+ agreed to reduce output in an effort to restore equilibrium.

However, with a series of unprecedented economic events (such as the hurricane on the gulf of Mexico and the war in Ukraine) exacerbating the upward move, the $100 p/b mark has proven to be significant, providing both support and resistance for the short and medium-term move.
After rising above the $93.5 resistance level at the beginning of the war (24 Feb 2022), oil prices experienced a massive surge before peaking at $130.5 in the first week of March. Since then, a drop back to the same level which now serves as support allowed bulls to fight back, before running into a wall of resistance at the $114 handle.
US Crude Oil (WTI) Weekly Chart
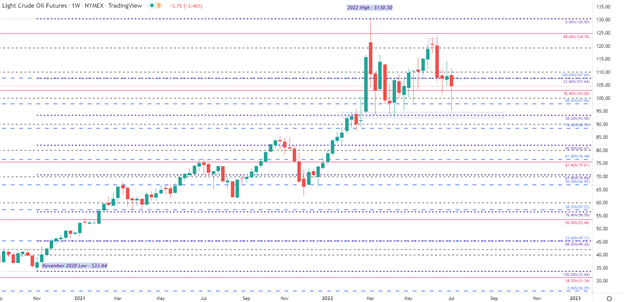
Chart prepared by Tammy Da Costa using TradingView
With both key psychological and Fibonacci levels currently in play, the daily chart further illustrates how technical levels have assisted in holding bulls and bears at bay. As prices continue to whipsaw between key Fibonacci levels at $97.86 and $113 respectively, both buyers and sellers have the opportunity to drive prices in either direction.
In order for upward trajectory to hold, bulls will need to conquer the $108 and $110 level, with the next level of resistance holding firm at $116,58 (the 14.4% Fib of the 2008 – 2020 move). If this level is broken, a break of the psychological $120 mark could leave the door open for a retest of the 2022 high at $130.5.
Introduction to Technical Analysis
Technical Analysis Tools
Recommended by Tammy Da Costa
US crude Oil (WTI) Daily Chart
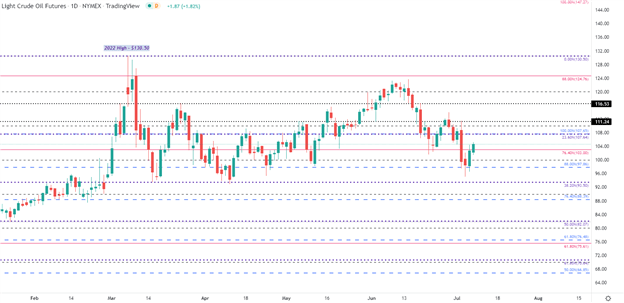
Chart prepared by Tammy Da Costa using TradingView
However, for bearish momentum to gain traction, sellers would need to drive prices below $100 which could then bring $93.56 (the 38.2% retracement of the Nov 2020 – 2022 move) into play. If prices continue to fall below $90.00 and $88.39 (23.6% Fib of the 2014-2016 move), it is possible for WTI to retest $80.00.
--- Written by Tammy Da Costa, Analyst for DailyFX.com
Contact and follow Tammy on Twitter: @Tams707


