


Gold Technical Forecast: Bearish
- Gold prices swung widely last week, shifting from near 2,000 to below 1,950
- The 1,900 psychological level may open up if bears break the 50-day SMA
- Momentum oscillators point to the prevailing weakness continuing this week

XAU/USD Technical Outlook
Gold prices moved lower over the past week of trading, breaking a two-week winning streak. Prices swung wildly, nearly breaking above the 2,000 level for the first time since early March before trimming strength and moving below the 1,940 mark. The intense selling as prices approached the psychological 2,000 level may indicate a healthy amount of sellers at that price point.
Bullion prices were offered support at the 50-day Simple Moving Average, with an intraday move on Thursday bouncing from that level but still ending the day with losses. That said, moving forward, these levels – 2,000 and the 50-day SMA – will likely be key to watch. Prices may range within those levels, but a break above or below may induce additional volatility.
The 20-day SMA held off three intraday selling attempts last week, so eyes will be focused there as well. Bears will likely continue to probe the moving averages after the Relative Strength Index (RSI) and MACD oscillators weakened. The RSI tracked below its center 50 line, and the MACD line crossed below its signal line, both bearish signals. That said, the path of least resistance appears to be skewed to the downside. The 1,900 levels offer an enticing target should bears prevail in the coming days.
XAU/USD Daily Chart
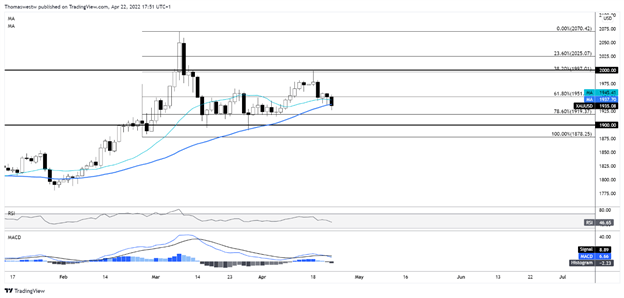
Chart created with TradingView
--- Written by Thomas Westwater, Analyst for DailyFX.com
To contact Thomas, use the comments section below or @FxWestwater on Twitter


