


Canadian Dollar, Majors-Based CAD Index, USD/CAD, Hammer – Weekly Technical Outlook
- Canadian Dollar saw a mixed week versus major peers
- Majors-based CAD index shows Loonie at key resistance
- USD/CAD outlook pending on action around trendline

Majors-Based Canadian Dollar Index Analysis – the Broader CAD Picture
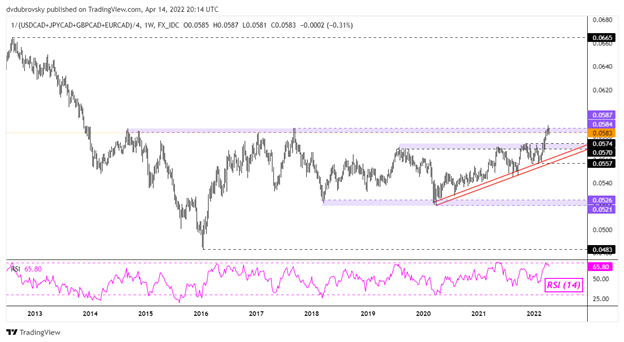
Below is a weekly chart of a majors-based Canadian Dollar index, which averages CAD against the US Dollar, Japanese Yen, British Pound and Euro. When the index rises, this represents the Loonie broadly gaining in value against its major counterparts. Looking back, CAD has generally been in an uptrend since March 2020, which was when the global pandemic accelerated.
Gains have brought the index towards a level of resistance that has consistently held since the middle of 2014. This could be a pivotal point, as breaking above could open the door to further reversing the broader downtrend that CAD saw from 2012 through the end of 2015. A turn lower on the other hand would place the focus on a rising trendline from 2020 – red parallel lines on the chart below.
Trade Smarter - Sign up for the DailyFX Newsletter
Receive timely and compelling market commentary from the DailyFX team
USD/CAD Technical Outlook - Neutral
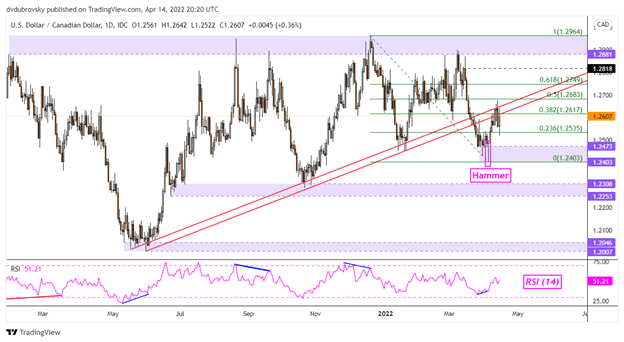
The Canadian Dollar has been recently struggling against the US Dollar. In March, USD/CAD broke under a rising trendline from May 2021, opening the door to extending losses towards lows from October. Since then, a range of support has been established between 1.2403 and 1.2473. The pair also left behind a Hammer candlestick pattern.
The latter is a sign of indecision, which can precede reversals after typically forming during a downtrend. Since then, there has been upside confirmation, undermining the breakout under rising support. Curiously, USD/CAD was unable to rise back above the trendline, still leaving the latter in play. A turn lower could place the focus on the range of support.
Falling under the latter would shift the outlook bearish, exposing the 1.2253 – 1.2308 support zone. Further taking out that zone would expose lows from May 2021, making for a range of support between 1.2007 and 1.2046. In the event prices rise back above the rising trendline, that would shift the outlook bullish, placing the focus on current 2022 peaks.
--- Written by Daniel Dubrovsky, Strategist for DailyFX.com
To contact Daniel, use the comments section below or @ddubrovskyFX on Twitter


