


S&P 500, Nasdaq 100, Dow Technical Forecast: Neutral
- It was a really strong week for stocks with gains in both the S&P 500 and the Nasdaq 100. The Dow put in a doji just under a big spot of potential resistance around the 35k psychological level.
- Stocks continue to show strength despite a plethora of risks on the horizon; and unlike much of the past 14 years since the Financial Collapse, the Fed may not be able to rush into save the day given current levels of inflation.
- While the fundamental environment is rife with risk, price action doesn’t match that at the moment. Below I look at scenarios on either side of the matter.
- The analysis contained in article relies on price action and chart formations. To learn more about price action or chart patterns, check out our DailyFX Education section.

It was another strong week for stocks, with equities continuing the rally from the prior week that triggered shortly after the FOMC rate hike. And this week we had some commentary from Jerome Powell amongst a slew of other Fed-speakers to add some context to the matter. There seemed to be a disconnect, as much of that Fed-speak pointed to continued hawkishness in effort of addressing inflation while identifying a number of other risks on the horizon. President Biden warning of a global food shortage this year. Jerome Powell pointed to the possibility of even more inflation from the price ramps that’ve shown in raw materials of late. And there’s still the continued war in Ukraine, with no resolution yet in sight. This can bring a wild set of unpredictable repercussions that are difficult to price with so much opacity.
Collectively this can spell for a troubling backdrop at the Fed considering how far behind the curve that they are with inflation. Yet, stocks have just continued to run-higher even with these risks flaring in-front of us. As such, the forecast will be set to neutral for next week, but I believe there remains bearish potential in here and next week may bring that to the forefront as Non-farm Payrolls on Friday puts the focus right back on employment data, which the Fed has pointed to as being a prime motivator for adjusting policy in the face of raging inflation.
S&P 500
The big level for last week in the S&P 500 was at 4500. We got there on Tuesday and it held as resistance into Friday, with late-week price action finally showing a bit of short-term support off of that level. At this stage, resistance has set at the 61.8% Fibonacci retracement of the January-February sell-off and this plots at 4538. I’m connecting that level up to a prior swing-high at 4550 to create a resistance zone.
A breach of that resistance opens the door for a move up to another key area, plotted from 4572-4586. Beyond those zones is a 3rd zone of interest from 4625 up to 4641.
Each of those resistance zones is fairly well-defined by prior price action. For bulls, these zones could operate as breakout areas and next targeted resistance zones. But, for bears, the two resistance zones above the current can be used for reversal potential provided that sellers actually show up there. For such an approach, often waiting on the four hour chart to indicate that resistance at the area can begin to open the door for reversal potential.
In the S&P 500, bears are going to want to see that 4500 level traded through before getting the idea that the trend is nearing another turn.
S&P 500 Daily Price Chart
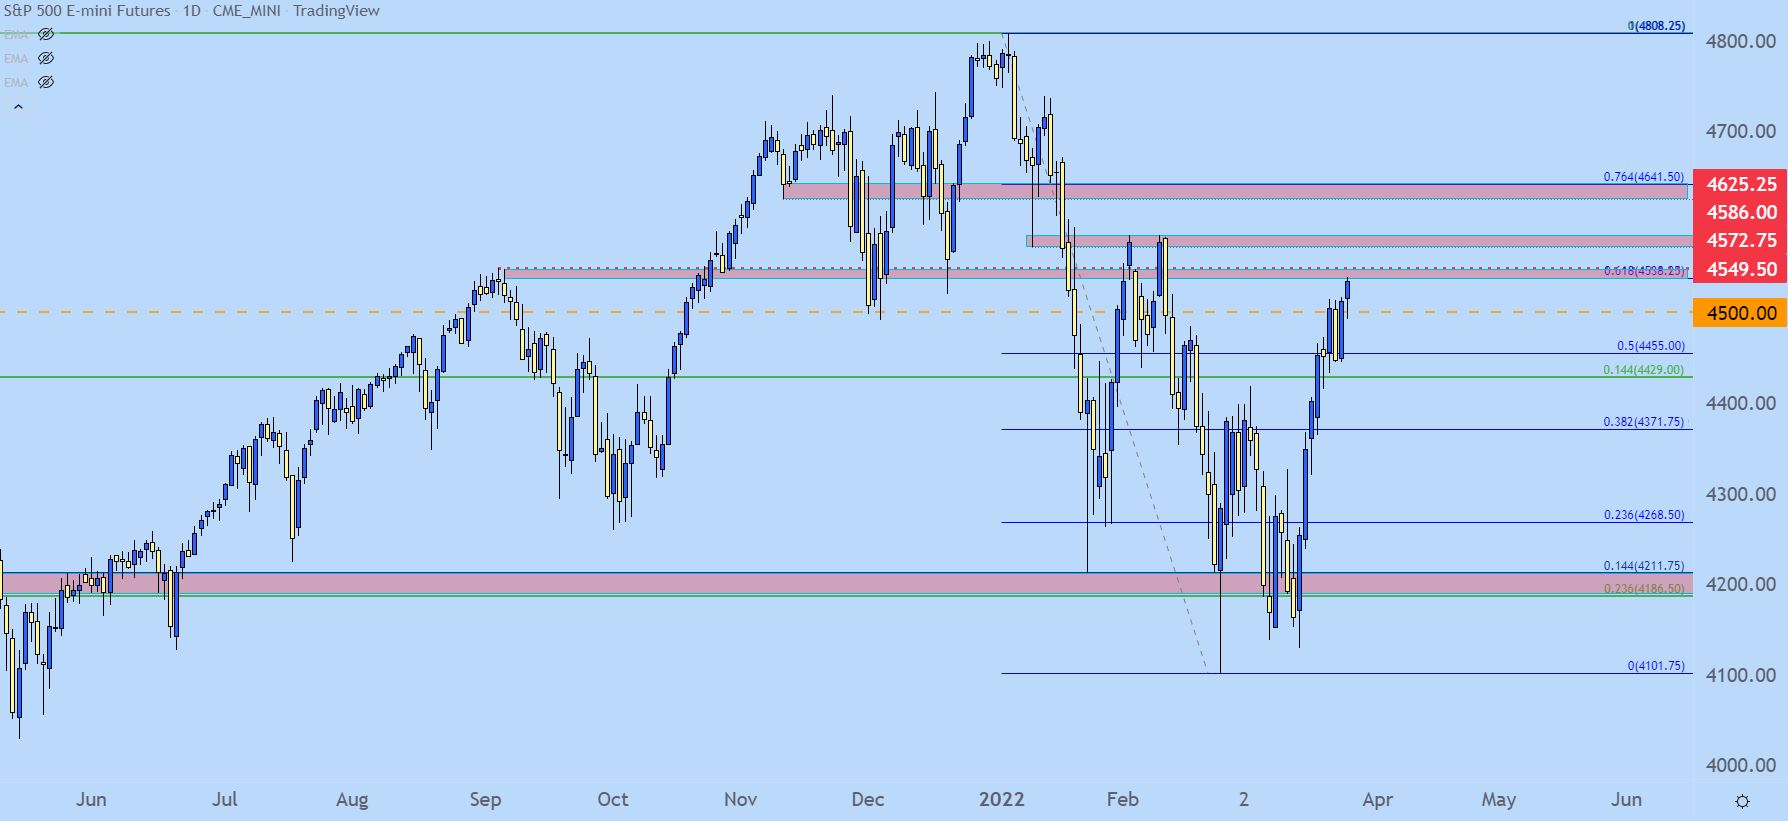
Chart prepared by James Stanley; S&P 500 on Tradingview
Nasdaq 100
For those looking at bearish swings, the Nasdaq 100 may be a more attractive venue. Just last week ahead of the FOMC rate decision, the index set a fresh ten month low. Since then, however, prices have jumped by almost 15%, in about nine trading days. This seems outlandish even for a low rate, heavy QE environment but I think it reflects the markets expectation for the Fed to do what they’ve been doing over the past decade-plus; and I don’t know if this is something that can be accomplished.
Nonetheless you can’t argue with price. So, I’m keeping the forecast at neutral here but similar to the S&P 500 above, there could be some bearish potential depending on how prices react around key levels next week.
The next major zone in the Nasdaq 100 is around the 15k psychological level. Beyond that, another spot of resistance exists from around 15,250 up to the Fibonacci level at 15,307. And if bulls can muster the momentum, there’s a third major spot of resistance around 15,700.
For support there’s a major zone that’s nearby, a hold of which can keep the door open for bullish trend strategies targeting that 15k spot, and this support zone was in-play for much of last week, running between 14,375 and 14,500.
For bears, resistance at 15k or the 15,255-15,307 zone would appear attractive for reversal scenarios.
Nasdaq 100 Daily Price Chart
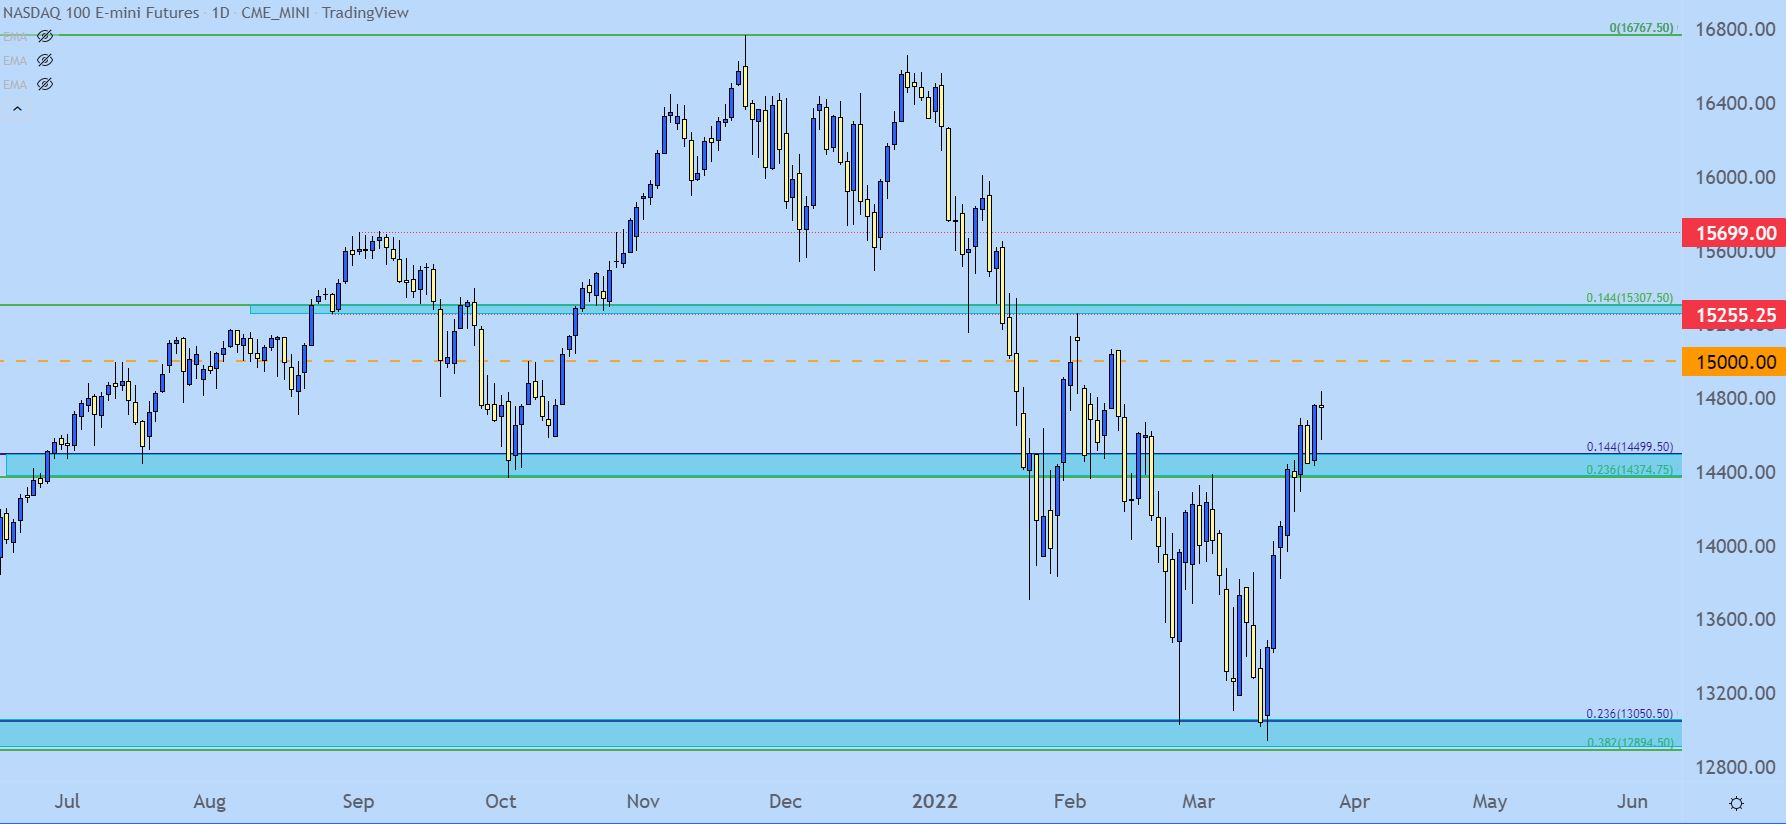
Chart prepared by James Stanley; Nasdaq 100 on Tradingview
The Dow Jones
The Dow is simultaneously the most stable of the three major US indices looked at in this piece while also being the one that appears to carry the most attractive bearish potential. Price action in the Dow was a bit more quiet this week, printing as a doji while holding inside of the 35k psychological level.
Dow Weekly Price Chart
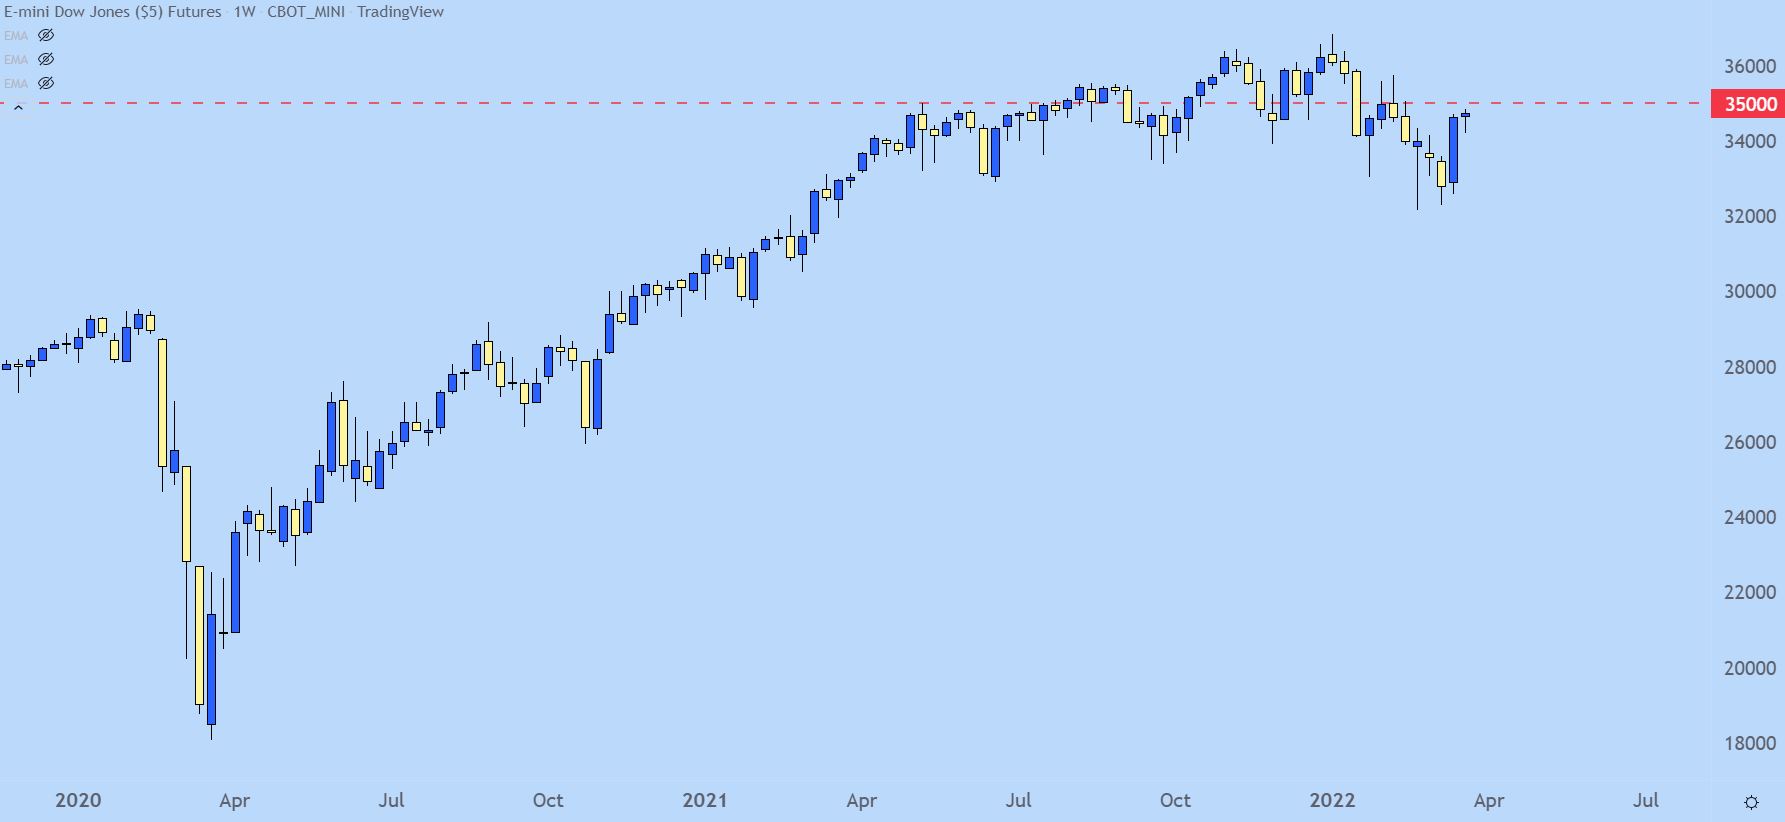
Chart prepared by James Stanley; Dow Jones on Tradingview
The Dow shorter-term illustrates that back-and-forth price action this week with a number of tests off of the support zone around 34,250. While both the Nasdaq 100 and S&P 500 saw those weekly trends start to tear away, the Dow was more in a state of stasis.
On the bearish side, a breach of support around that 34,250 zone re-opens the door for shorts, and there’s deeper support potential around 33,824, 33,500 and then the major support that caught the lows in February and March around 32,500.
On the bullish side, buyers are likely going to want to see the 35k level dealt with first before plotting breakouts or trend extensions, but that same support can keep the door open for topside strategies around 34,250. The key is confirming a support hold in order to allow for risk management, because if that support zone gives way there may be another theme coming into the picture.
Dow Jones Daily Price Chart
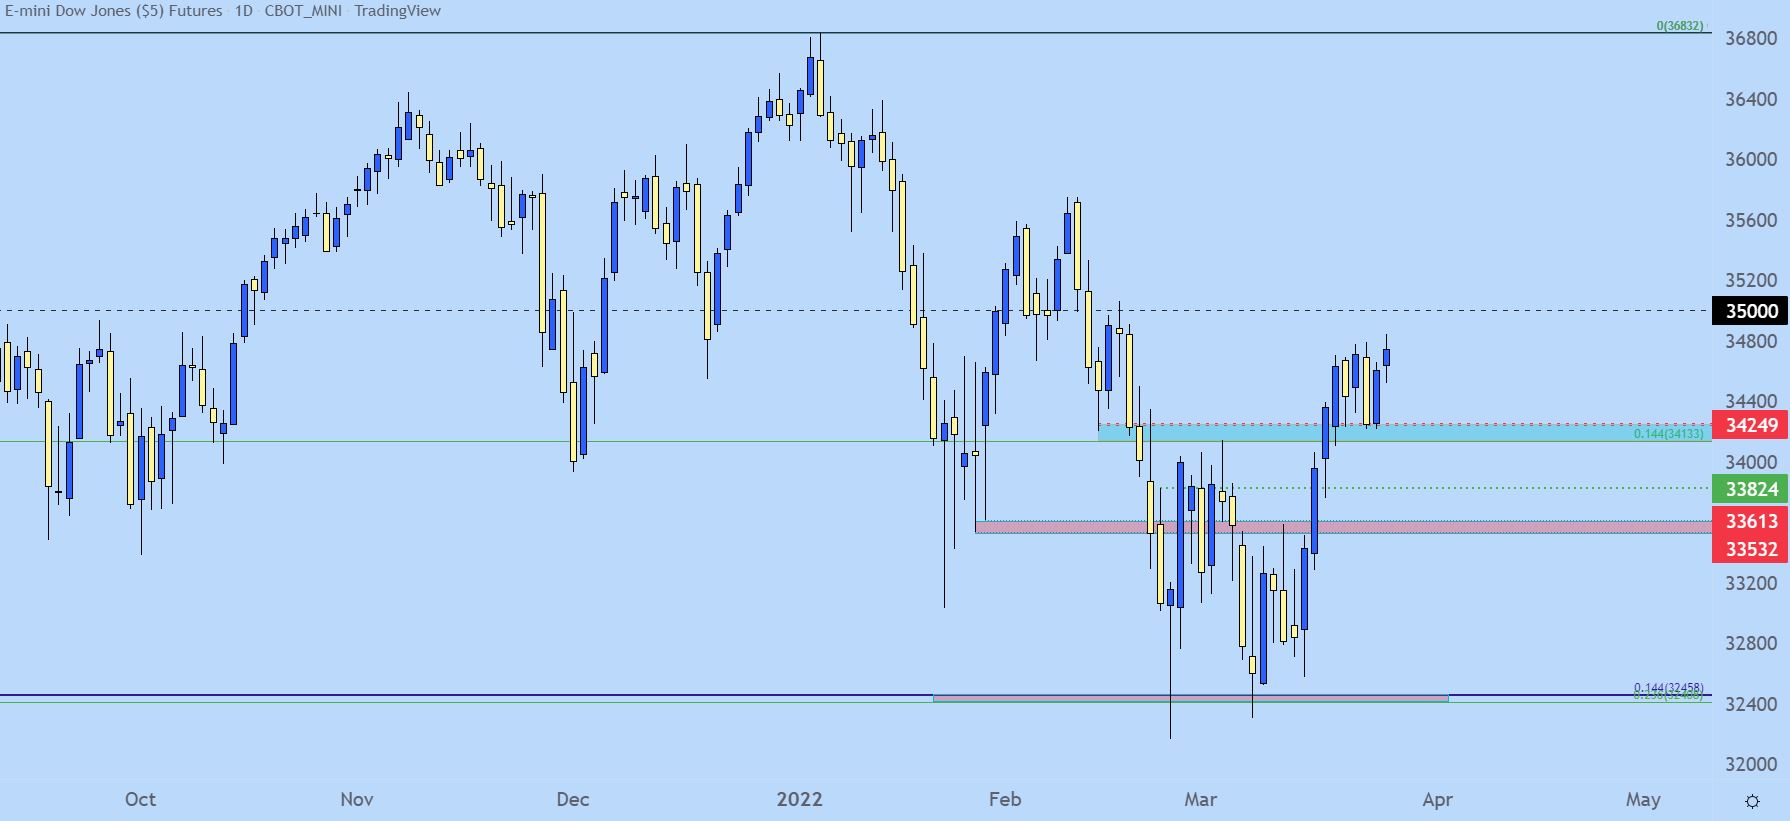
Chart prepared by James Stanley; Dow Jones on Tradingview
--- Written by James Stanley, Senior Strategist for DailyFX.com
Contact and follow James on Twitter: @JStanleyFX


