


Indices Technical Forecast: Neutral
- S&P 500 looking towards the 200-day moving average
- Nasdaq 100 is lagging behind, well below the 200-day
- Dow Jones has trend-line in play and the 200-day just ahead
S&P 500 Technical Forecast
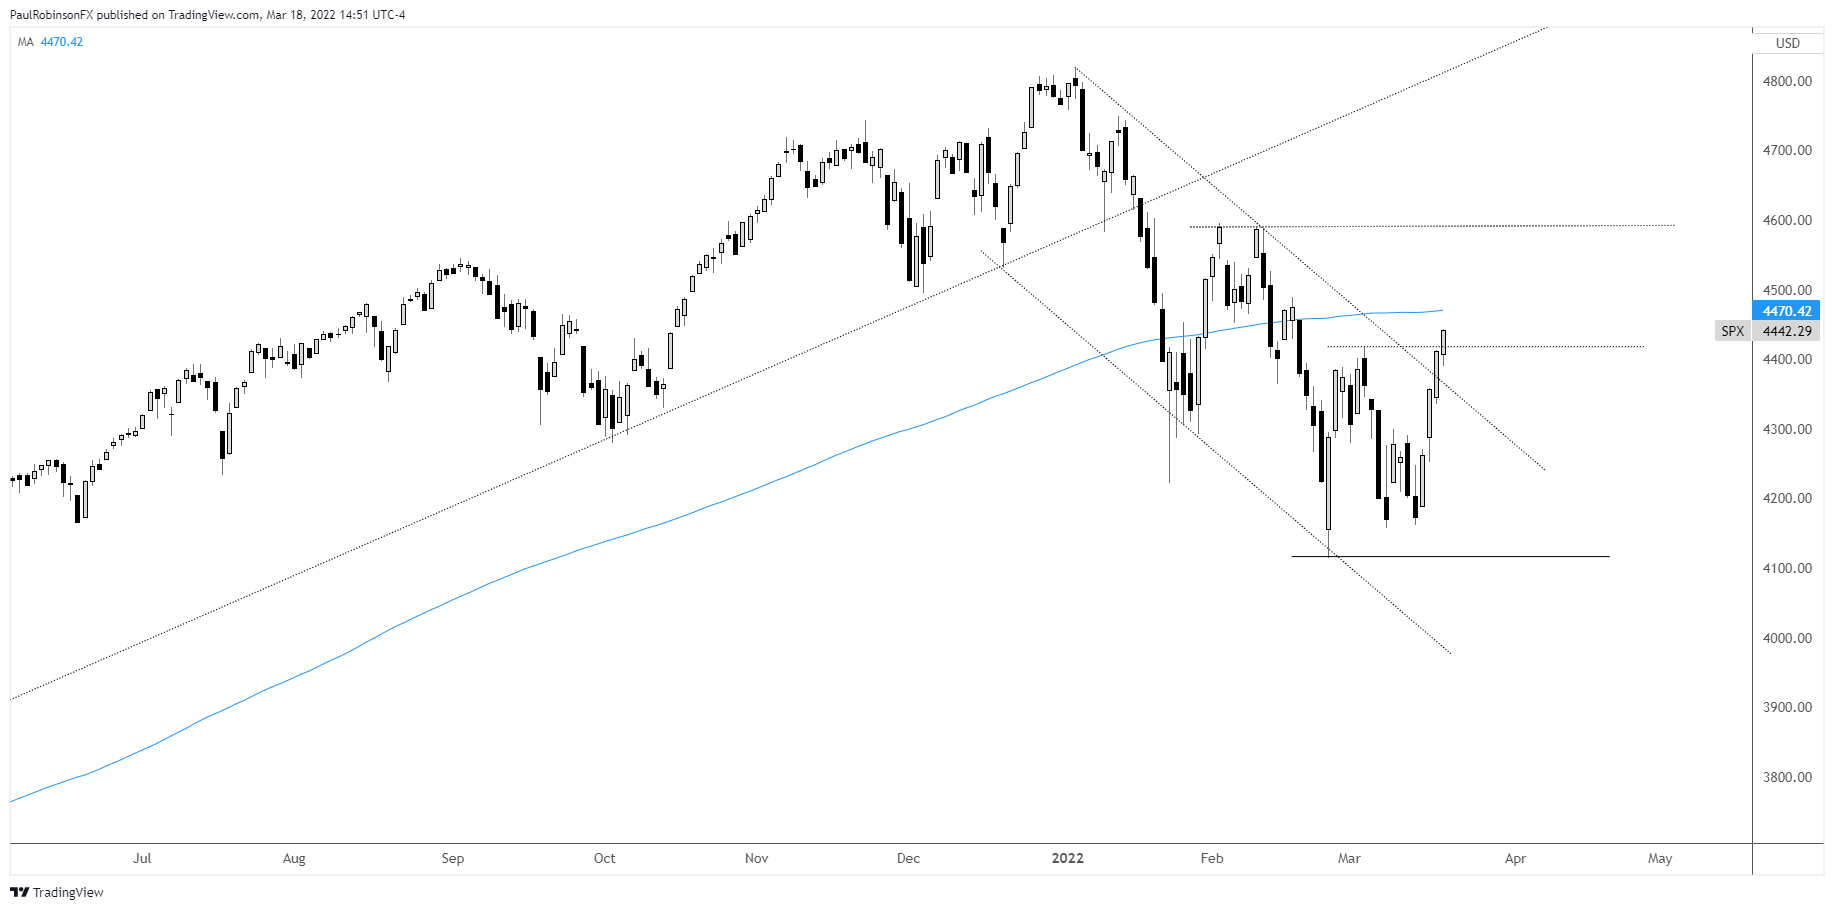
The S&P 500 is coming off recent low levels in strong fashion, bringing into play the 200-day moving average. It was broken in convincing fashion a month ago, and in the days ahead it is seen as likely being a focal point for the market.
It is seen as probable that the 200-day could at least put in a pause to the rise, if not causing a bit of a sharp reaction even if the market is to eventually go on to reclaim it as support. Given where we are in the bounce cycle it is a difficult spot to enter longs without running the risk of getting caught in a pullback.
As for short positions, it is ideal that we see some indication that the market wants to turn back lower, i.e. a strong reversal day. And do so at a key level/line of resistance such as the 200-day MA. In the days ahead we should get a better idea of how to handle the SPX.
S&P 500 Daily Chart
Nasdaq 100 Technical Forecast
TheNasdaq 100 is quite a ways away from the 200-day moving average, looking to try and climb above its most recent swing high at 14342. This will be a level to watch as other indices hit the more important 200-day MAs. A swift reversal off 14342 could at least provide a short-term short opportunity for the nimble. A daily close above resistance takes that idea off the table.
Nasdaq 100 Daily Chart
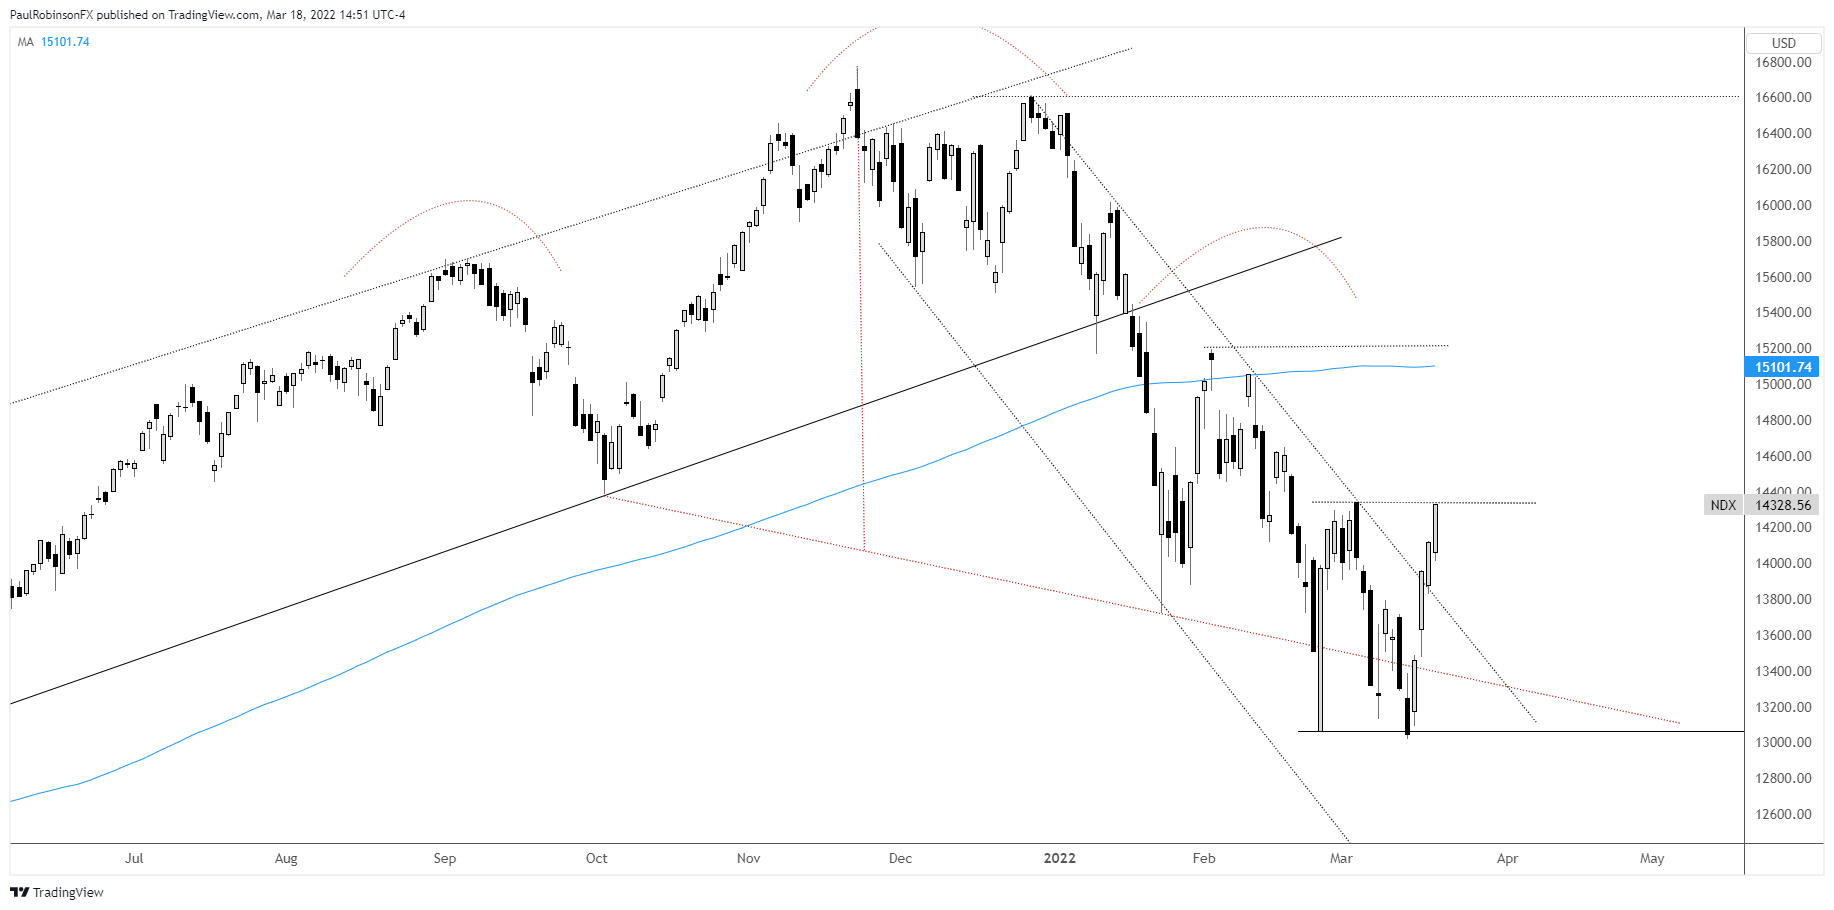
Nasdaq 100 Chart by TradingView
Dow Jones Technical Forecast
The Dow Jones has a trend-line off the record high to contend before it can take on the 200-day moving average, but it is still very much an attainable level in the near-term. On the downside there is good support for the Dow just above the 34k mark. A pullback into this area before a move higher could offer up a long opportunity for those looking to buy a support level that allows for stop placement just on the other side of it.
Whether it is a short off a further push into and reverse from the 200-day, or a pullback and reverse off support around 34k, there looks like good potential for some trading opportunities this coming week.
Dow Jones Daily Chart
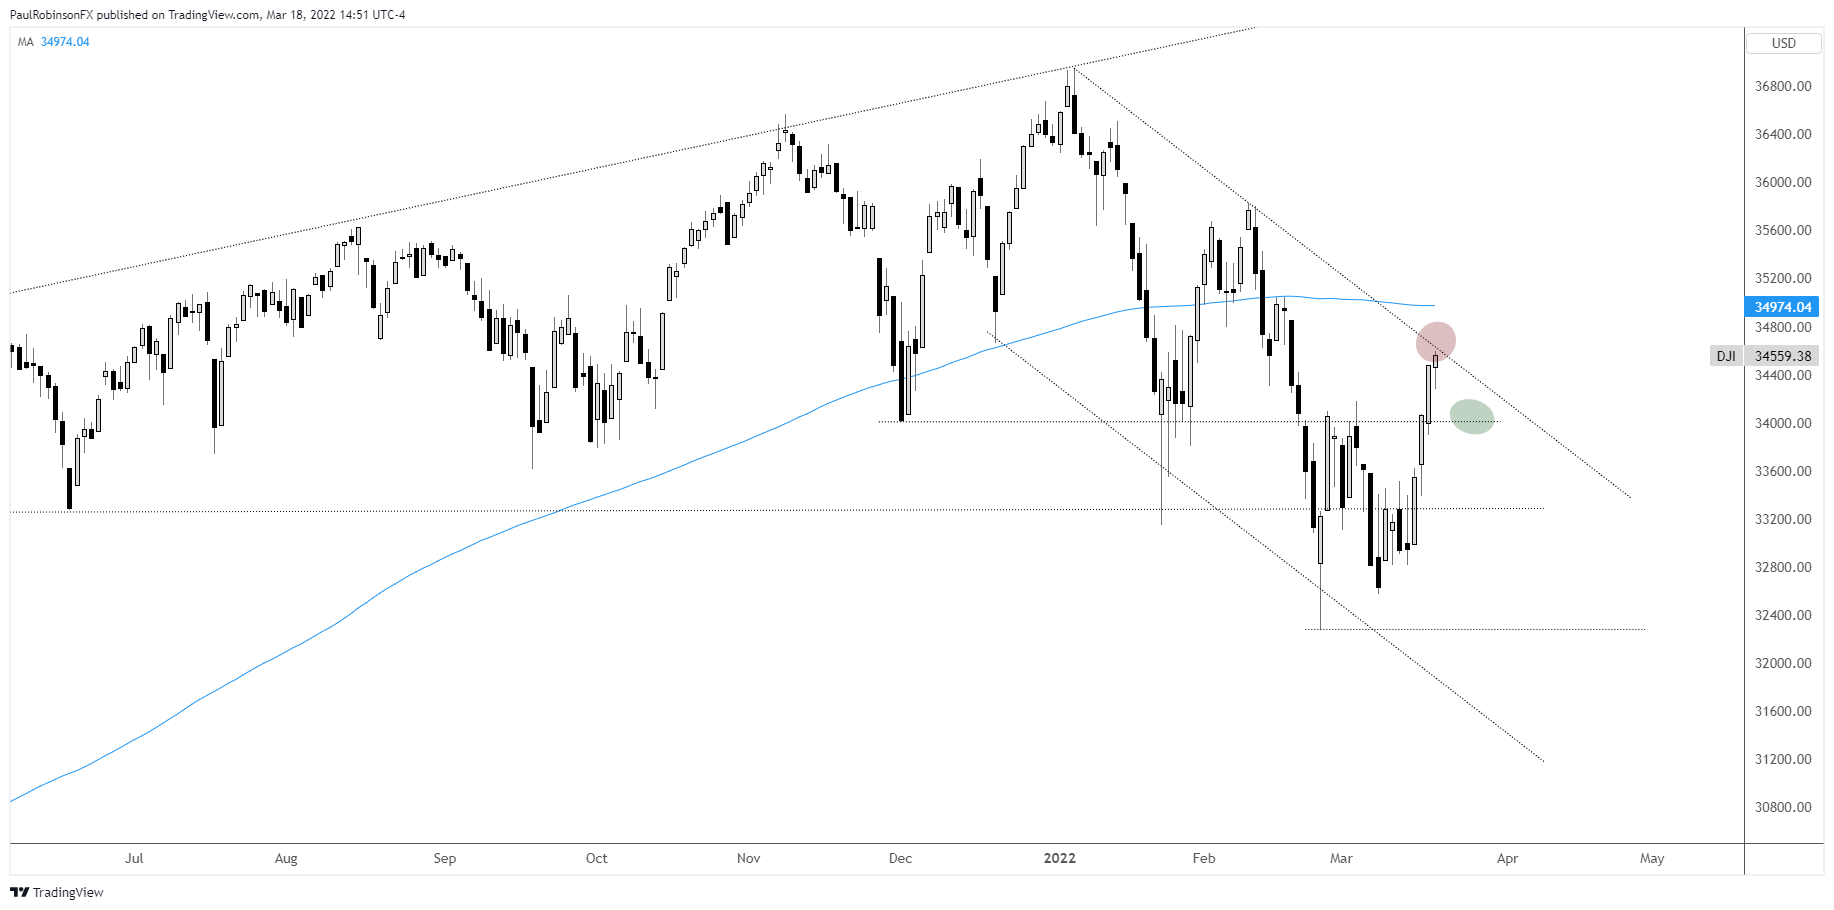
Dow Jones Chart by TradingView
Resources for Forex Traders
Whether you are a new or experienced trader, we have several resources available to help you; indicator for tracking trader sentiment, quarterly trading forecasts, analytical and educational webinars held daily, trading guides to help you improve trading performance, and one specifically for those who are new to forex.
---Written by Paul Robinson, Market Analyst
You can follow Paul on Twitter at @PaulRobinsonFX


