


Gold ended a two-year uptrend in August 2020. A modest pullback from there gave way to sideways drift in March 2021. Prices are now idling near the mid-point of the choppy range that has been carved out since. It is unclear whether the standstill will mark a base for renewed gains or a pause before the down move from the 2020 top is re-engaged.
Spot Gold (XAU/USD) – Weekly Chart
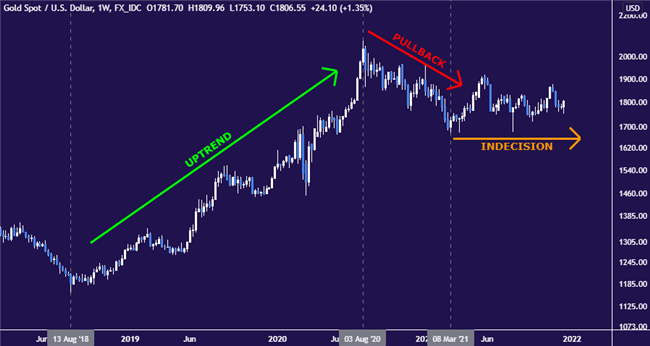
Chart created with TradingView
Zooming in to the daily chart, prices are attempting to grind upward through mid-range congestion near the $1800/oz figure. A sequence of higher highs and lows cautiously favors gains within the well-established $1677-1917 band. Immediate resistance is at 1808.16, followed by barriers in 1834 and 1871. Key supports are at 1750.78, 1818.89 and 1676.91.
Spot Gold (XAU/USD) – Daily Chart
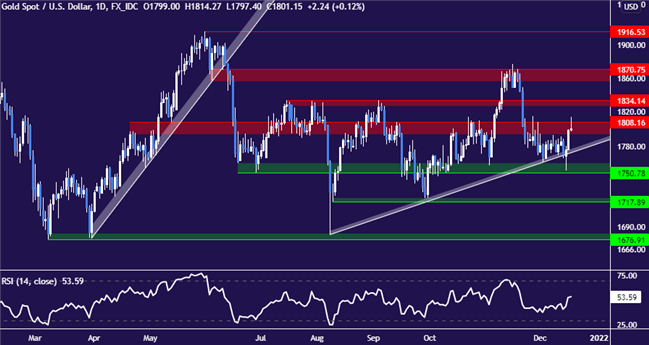
Chart created with TradingView


