


British Pound Technical Forecast
- GBP/USD up against the yearly low, more to go?
- GBP/AUD barely breaks multi-week losing streak
- GBP/JPY touches 50-day SMA after down week

GBP/USD Technical Forecast: Bearish
The Sterling put in a big 1.4% drop versus the Greenback last week, making it one of the worst performers across the G10 FX space. GBP/USD traded near its yearly low moving into the weekend. That weakness may continue in the coming days, with MACD accelerating to the downside following a cross below its center line.
GBP/USD’s 2021 low at 1.3410 will likely pose solid support. A break below that may further energize bears and push prices into 2020 levels. The Relative Strength Index (RSI) is tracking lower within neutral territory on the daily timeframe, suggesting the move lower may have more to go. A rebound will see the falling 50-day Simple Moving Average shift into focus as potential resistance.
GBP/USD Daily Chart
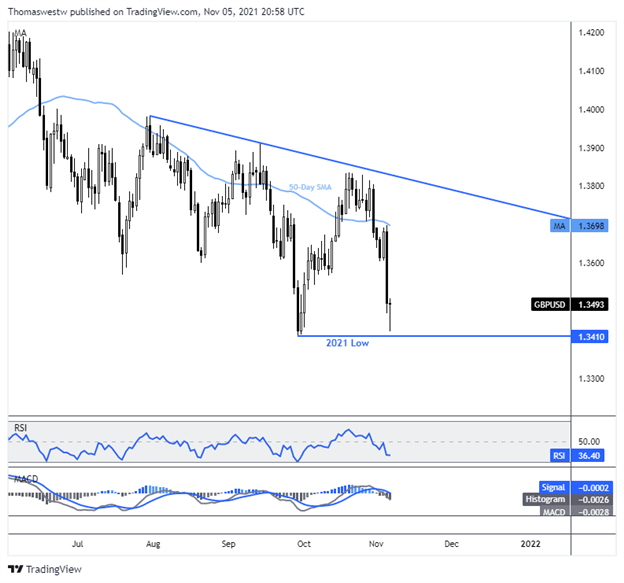
Chart created with TradingView
GBP/AUD Technical Forecast: Slightly Bearish
The British Pound lost ground versus the Australian Dollar late last week, but prices managed to end the week with a slight gain. That broke a six-week losing streak in the currency pair. Still, prices are down over 3.5% from the September swing high at 1.8960 and more than 4.5% from the 2021 August swing high at 1.9154.
The falling 20-day Simple Moving Average (SMA) appeared to cap upside last week after intraday price swings failed to hold gains above the level. To the downside, a supportive trendline in place since early September may underpin prices if bears resume control this week. If so, the 1.8000 psychological level will come into focus as potential support.
GBP/AUD 8-Hour Chart
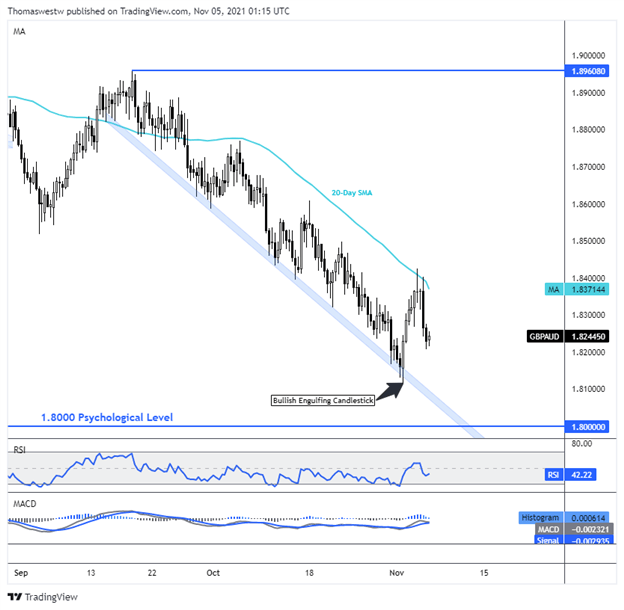
Chart created with TradingView
GBP/JPY Technical Forecast: Neutral
British Pound weakness accelerated last week against the Japanese Yen, with GBP/JPY falling nearly 2%. The rising 50-day Simple Moving Average underpinned prices, but bears continued to probe the level heading into the weekend. The currency pair was making significant progress until late October when prices quickly fell from fresh yearly highs.
A drop under the 50-day SMA will open the door for a test of former triangle resistance, which could potentially turn into support. A turn higher may see the bullish energy from early- to mid-October return, however. That could bring the chance for fresh 2021 highs to be made, although it would require a rather strong rally.
GBP/JPY Daily Chart
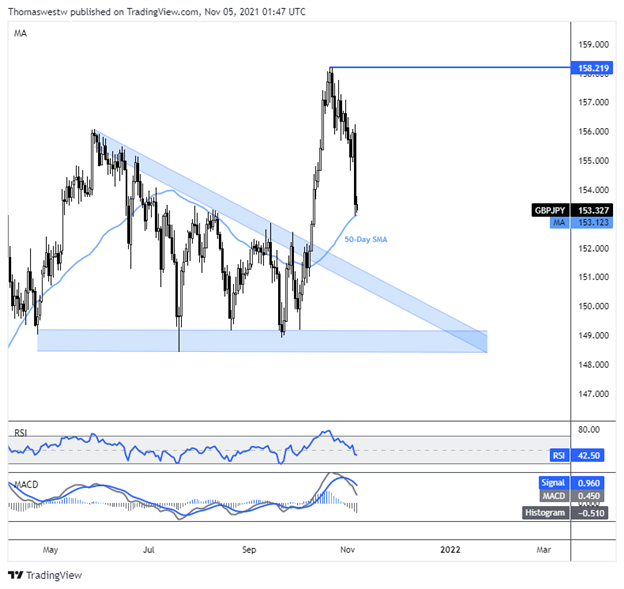
Chart created with TradingView

--- Written by Thomas Westwater, Analyst for DailyFX.com
To contact Thomas, use the comments section below or @FxWestwater on Twitter


