


USD/JPY, EUR/JPY - Talking Points
- The Japanese Yen has been weakening against both the USD and EUR
- USD/JPY has seen a significant lift higher after clearing numerous hurdles
- While EUR/JPY has moved up, it still has work to do. Will it break the range?

USD/JPY – Technical Analysis
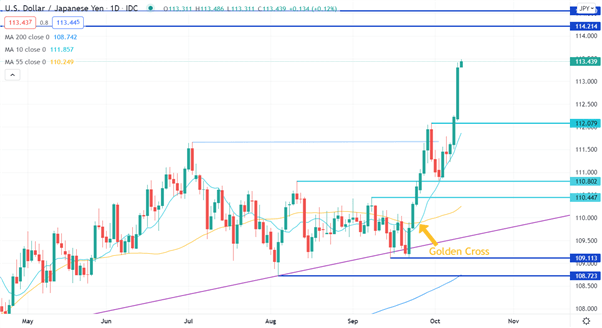
USD/JPY ran higher this week to levels not seen since Q4 2018. The highs in 2018 of 114.214 and 114.550 are the next potential resistance levels.
The Triple Moving Average (TMA) is often seen as a powerful momentum signal when it turns on. There are specific conditions required for the TMA to turn on and so it does not give a signal very often. For USD/JPY, I am using three simple moving averages (SMAs) on the chart below: the 10-day, 55-day and 200-day.
The first condition is order. For a bullish signal, the asset price must be above the short term SMA, which must be above the medium term SMA, which must be above the long term SMA. The second condition is that the slope of all 3 moving averages must have a positive gradient. For a bearish signal, the reverse of all these conditions must be met.
The TMA turned on last week when the 10-day SMA crossed above the 55-day. This is also a Golden Cross, which is a potential bullish signal on its own.
On the downside, support could be at the pivot points of 112.079, 110.802 and 110.447.
USD/JPY CHART

EUR/JPY Technical Analysis
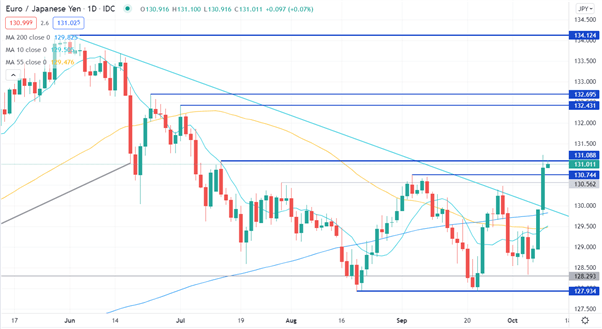
EUR/JPY has been in the range of 127.934 – 131.088 since July. It has recently broken above several resistance levels – the 200-day SMA of 129.778 at the time, a descending trend line at 129.980 and a previous high of 130.744.
While the price has briefly been above a previous high of 131.088, a close above that level would be needed to confirm that the range is no longer intact.
Support might lie at the previous high and now pivot point of 130.744, the 200-day SMA currently at 129.825, or the bottom the range at 127.934.
Above the previous high of 131.088, potential resistance could be offered at previous highs of 132.431, 132.695 or 134.124.
The 10-day is close to crossing above the 55-day SMA today, which is a possible bullish Golden Cross.
EUR/JPY CHART
--- Written by Daniel McCarthy, Strategist for DailyFX.com
To contact Daniel, use the comments section below or @DanMcCathyFX on Twitter


