


Australian Dollar Technical Forecast – Talking Points
- AUD/USD looking to resume Rising Wedge breakdown
- GBP/AUD looks for direction break from Falling Triangle
- AUD/JPY threatens to breakdown from Rising Wedge

AUD/USD Technical Forecast: Bearish
The Australian Dollar pivoted slightly lower against the US Dollar last week. AUD/USD failed to overtake a former support level that made up a Rising Wedge formation. The price behavior is rather normal, as post-wedge breakouts commonly return to retest the prior levels of resistance/support. The failure to overtake the pattern’s former support level likely bolstered bearish confidence for a move lower.
That said, prices may continue to fall in the near term. A drop to the wedge’s initial starting point at 0.7286 may be in the cards and would mark a decisive point for further direction, with a drop lower likely seeing an extension of the downtrend. Moreover, an SMA crossover between the 100- and 200-day Simple Moving Averages occurred late in the week. That is a bearish sign and may open the door for more overhead pressure on the currency pair.
AUD/USD 8-Hour Chart
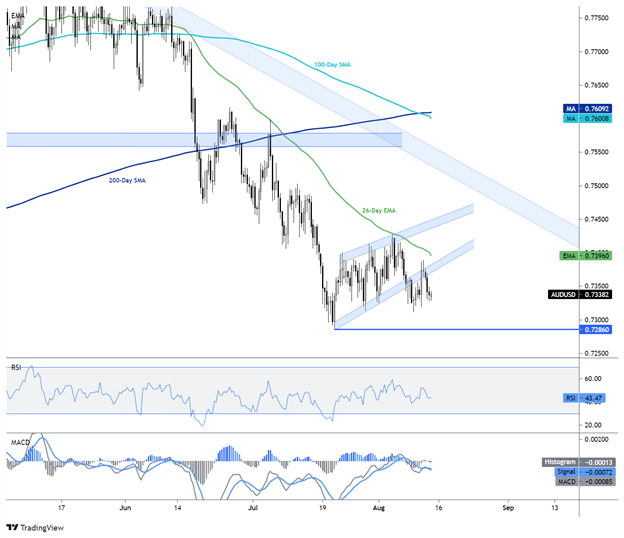
Chart created with TradingView
GBP/AUD Technical Forecast: Neutral
The Australian Dollar may be on the verge of reversing recent gains against the British Pound as a Descending Triangle takes shape. Typically the pattern results in a continuation of the prior trend, however, but the outlook may remain unclear until prices decide to make a move. That said, the direction of the breakout may serve as a signal for traders to take a position as the consolidation pattern continues.
The rising 20-day Simple Moving Average (SMA) may provide support in the event prices continue lower, which is currently in a confluent area with the triangle’s lower bound. However, RSI and MACD on the four-hour timeframe are both trending lower, which leaves the currency pair with conflicting technical indicators. Thus, a neutral approach to the outlook may be prudent.
GBP/AUD 4-Hour Chart
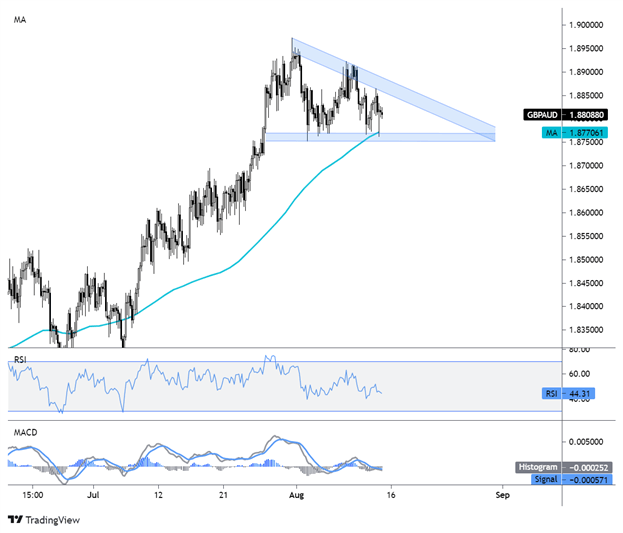
Chart created with TradingView

AUD/JPY Technical Forecast: Slightly Bearish
AUD/JPY appears to be breaking lower from a Rising Wedge pattern, which formed over the past couple of weeks. Prices were rejected from the wedge’s upper bound, along with confluent resistance from the falling 26-day Exponential Moving Average late last week. After some conflict at the lower bound of the pattern, support gave way.
Typically, a Rising Wedge results in a breakdown in prices once the support level is broken. That said, the overall bias is now skewed to the downside. Dropping to the pattern’s low point at 80.13 may be in the cards. Moreover, the MACD and RSI oscillators are both tracking lower, which indicates downside momentum is intact.
AUD/JPY 4-Hour Chart
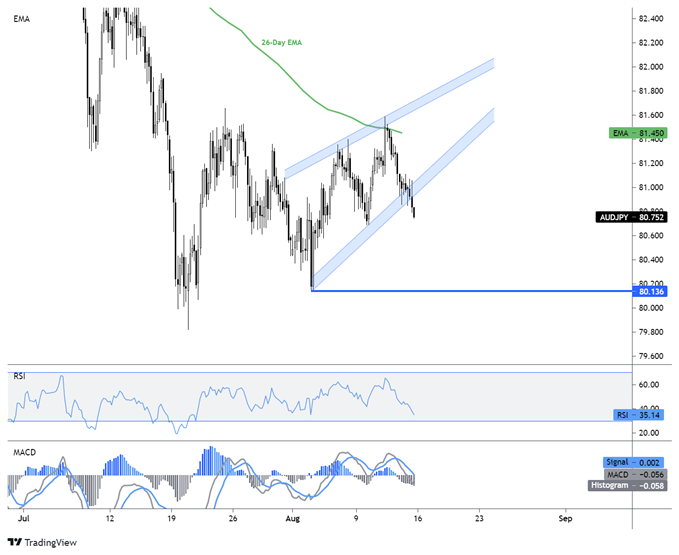
Chart created With TradingView

Australian Dollar TRADING RESOURCES
- Just getting started? See our beginners’ guide for FX traders
- What is your trading personality? Take our quiz to find out
- Join a free webinar and have your trading questions answered
- Subscribe to the DailyFX Newsletter for weekly market updates
--- Written by Thomas Westwater, Analyst for DailyFX.com
To contact Thomas, use the comments section below or @FxWestwater on Twitter


