


Dow Jones, Nasdaq 100, S&P 500 Forecast: Bullish
- It was another week of strength for US equities, with all of the Dow, S&P 500 and Nasdaq 100 putting in gains on the week.
- The big story in stocks is the outperformance of the Dow. While the Nasdaq has been ripping for some time, the Dow finally put in a strong move above the 35k level.
- The analysis contained in article relies on price action and chart formations. To learn more about price action or chart patterns, check out our DailyFX Education section.

US stocks gained again this week even with another +5% inflation print being released, this time for the month of July. The optimism, however, is that more evidence seems to be pointing to at least some of that inflation being transitory in nature, which could allow for the Fed to remain ‘pedal-to-the-floor’ on the accommodation front. And this has helped to keep investors behind the bid in US equities even despite the warning from FOMC Vice Chair, Richard Clarida, last week that the Fed may be ready to begin tapering asset purchases by the end of the year.
That comment helped to spark a rise in US yields and the NFP report last week brought more of the same. US yields continued to increase this week until that inflation print was released: But the big mark on inflation was on Friday on the heels of a disappointing US Consumer Sentiment report.
That shift in yield did have some impact across equities as it helped the Dow Jones outperform the Nasdaq, which has proven to be a more rates-sensitive market as expectations over future FOMC policy have vacillated so far in 2021.
The Dow Jones put in a strong topside move this week, sustaining a breakout beyond the 35k level that had provided resistance from early-May into last week. Prices pushed above that level on the heels of the NFP report, and after a check-back to support at prior resistance on Monday, bulls drove and prices ran up to another fresh all-time-high in the Dow.
Dow Jones Weekly Price Chart: Fresh All-Time-Highs
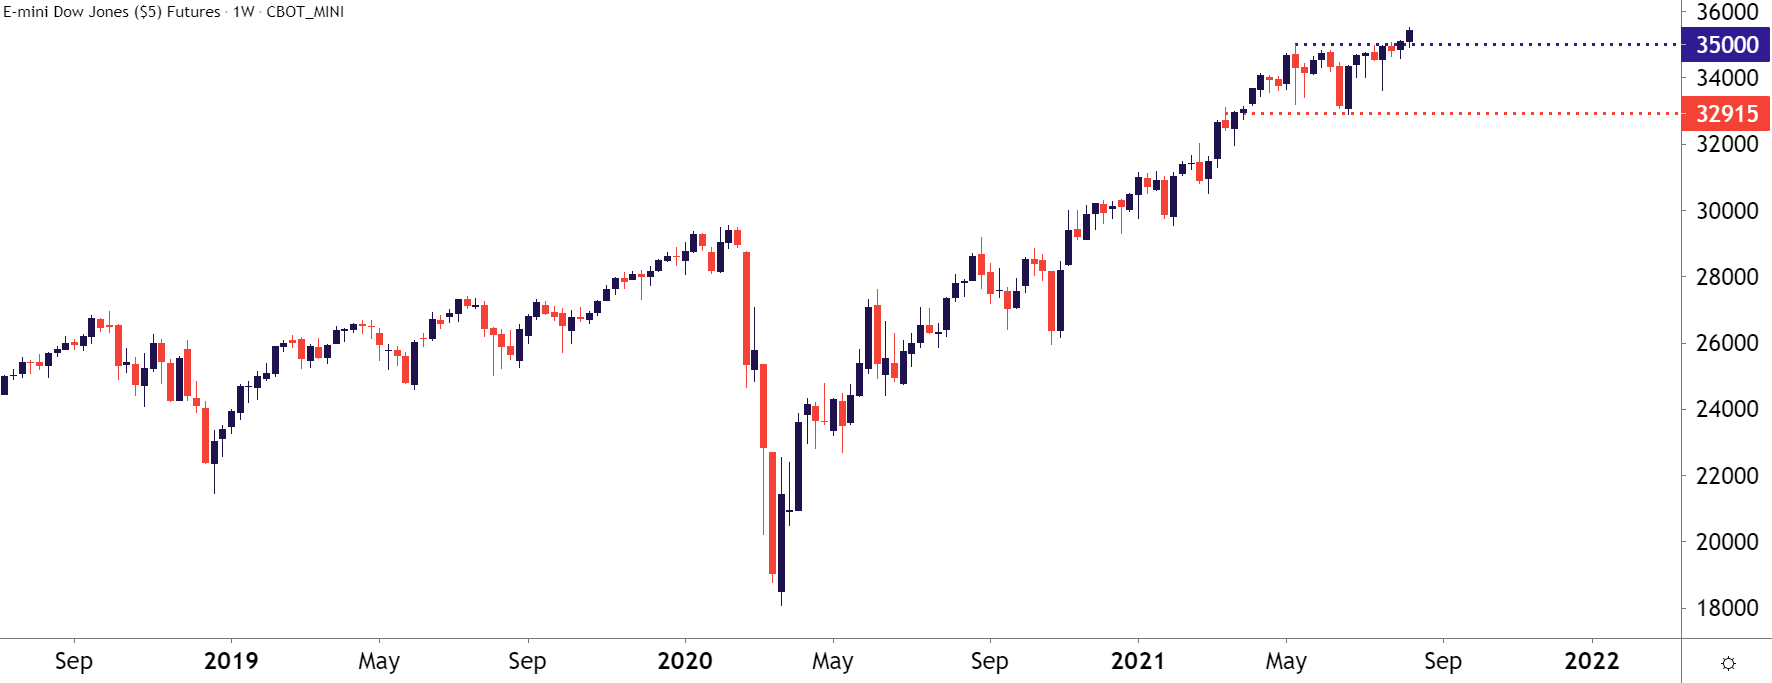
Chart prepared by James Stanley; Dow Jones on Tradingview

For levels, taking a shorter-term look at the four-hour chart: There’s potential support around the prior swing-low in the 35,250 vicinity. But, realistically, its that 35k level that held as resistance for almost three months that’s the obvious point of nearby support. Below that is another prior swing low, taken from around 34,600 that could be used for invalidation of short-term bullish trend approaches.
Dow Jones Four-Hour Price Chart

Chart prepared by James Stanley; Dow Jones on Tradingview
Nasdaq 100
The week ended better than it started for bulls, as the Nasdaq had pulled back on Tuesday and Wednesday, and even started Thursday’s US equity session below the 15k psychological level. But a big move on the open propelled prices back above that marker, and prices trended higher through the rest of Thursday and Friday trade.
At this point the high-flying index still appears to be struggling to sustain the move above the 15k marker; and the recent focus on rates likely hasn’t helped. But, the trend has remained strong here and buyers again proved their bias with another week of strength in the index.

Nasdaq 100 Daily Price Chart
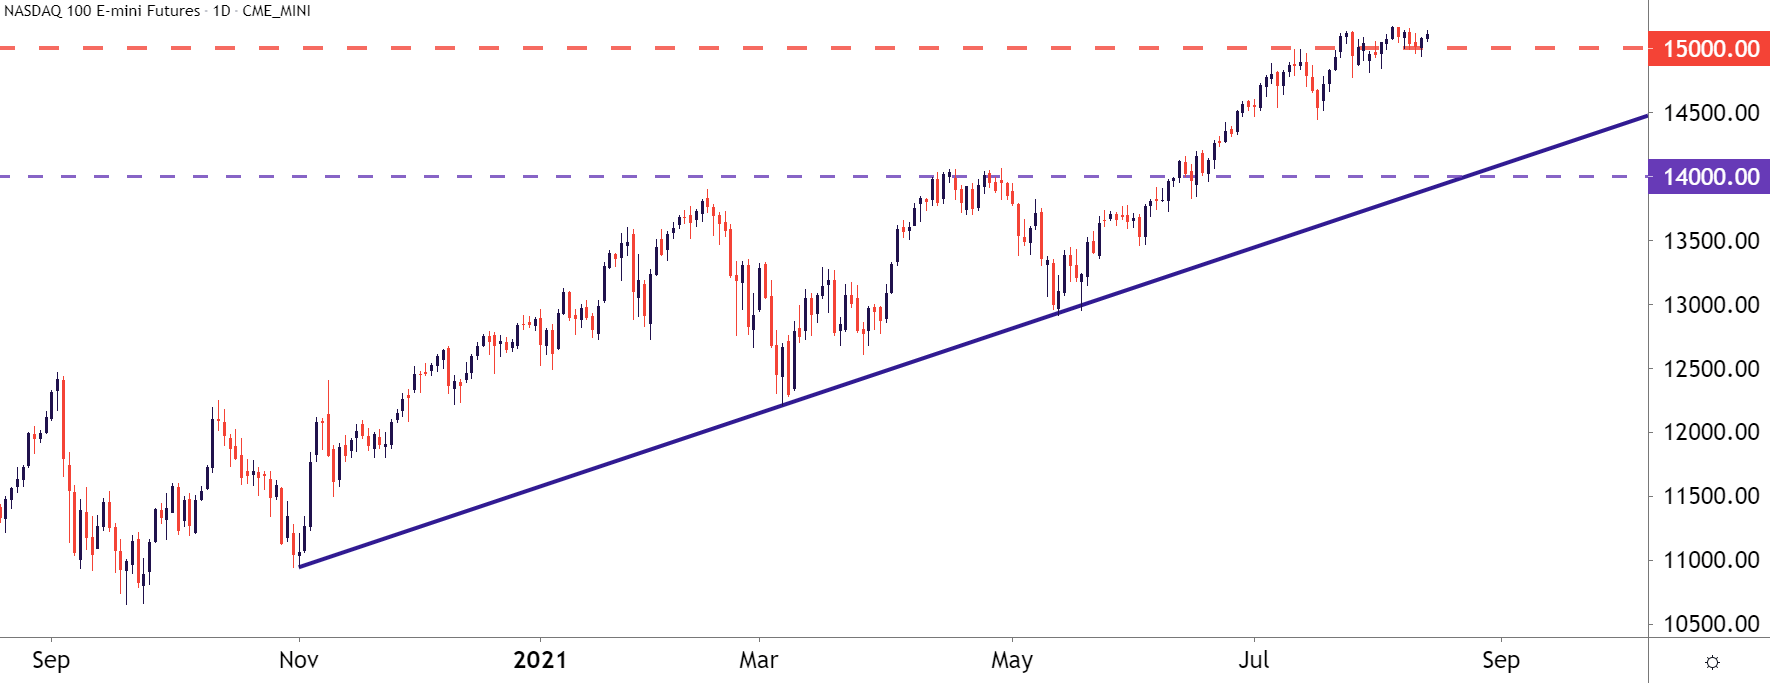
Chart prepared by James Stanley; Nasdaq 100 on Tradingview
Taking a shorter-term look at the index below, we can see where the Nasdaq has been mean reverting over the past couple of weeks. The current zone could be a challenging one as there’s been a few different resistance inflections here thus far. A breach above could re-open the door for bullish breakout strategies but, outside of that, support in the 14819-14859 range could be attractive for bulls looking to add exposure.
Nasdaq 100 Four-Hour Price Chart
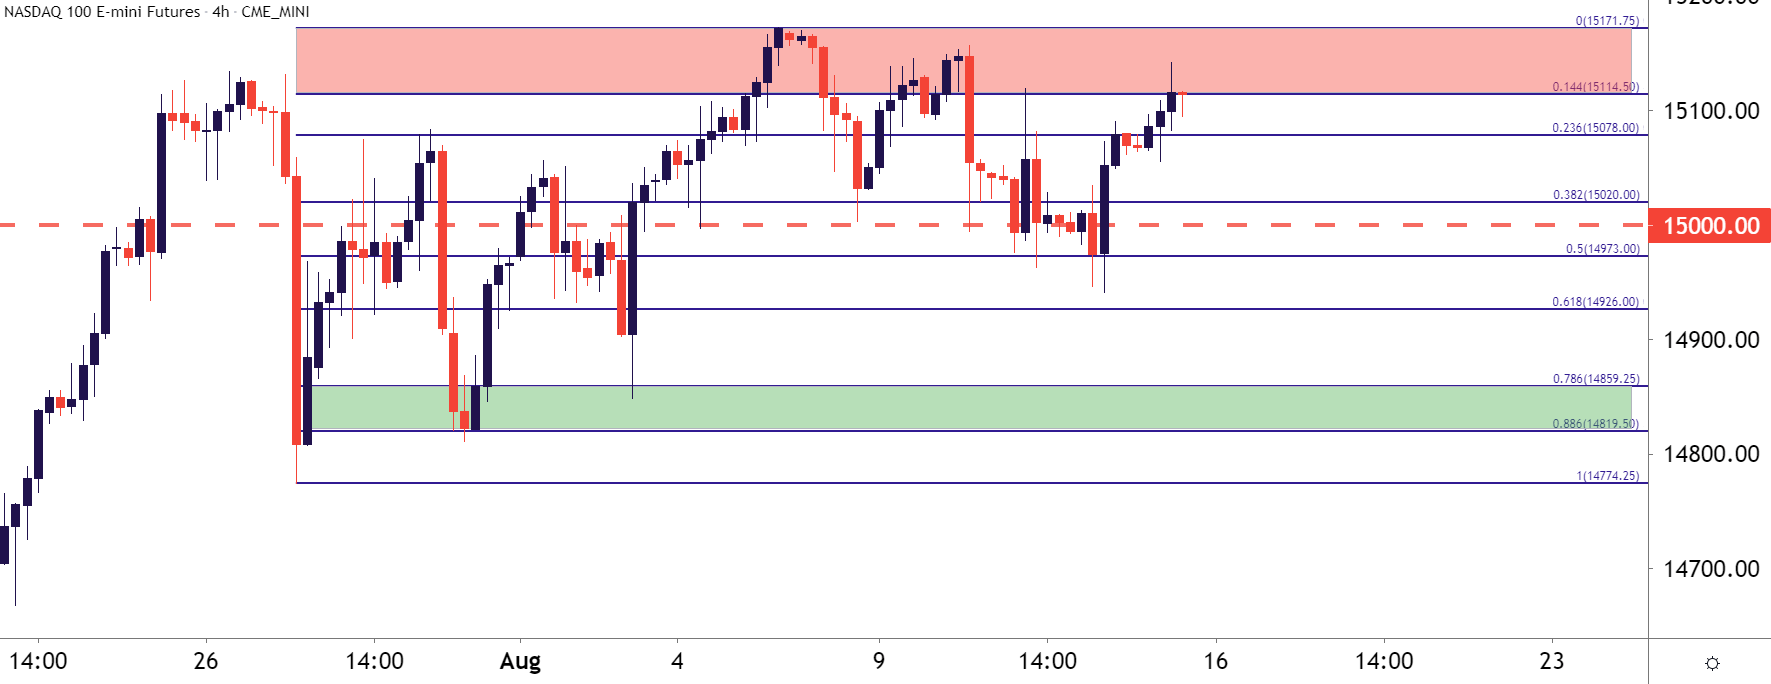
Chart prepared by James Stanley; Nasdaq 100 on Tradingview
S&P 500
The last three days of the week helped to push the S&P 500 to yet another fresh all-time-high. After the mid-July pullback in the index, bulls have been large and in-charge and there’s no sign yet of that letting up. There was a big of resistance around 4416 that showed up in late-July and remained into the first week of August. This level could be looked to as nearby support potential, and below that is a zone of interest running from the approximate 4364-4384.
On the resistance side of the matter, the 4500 psychological level is of note, and at 4482 is a 161.8% Fibonacci extension from that mid-July pullback.
S&P 500 Daily Price Chart
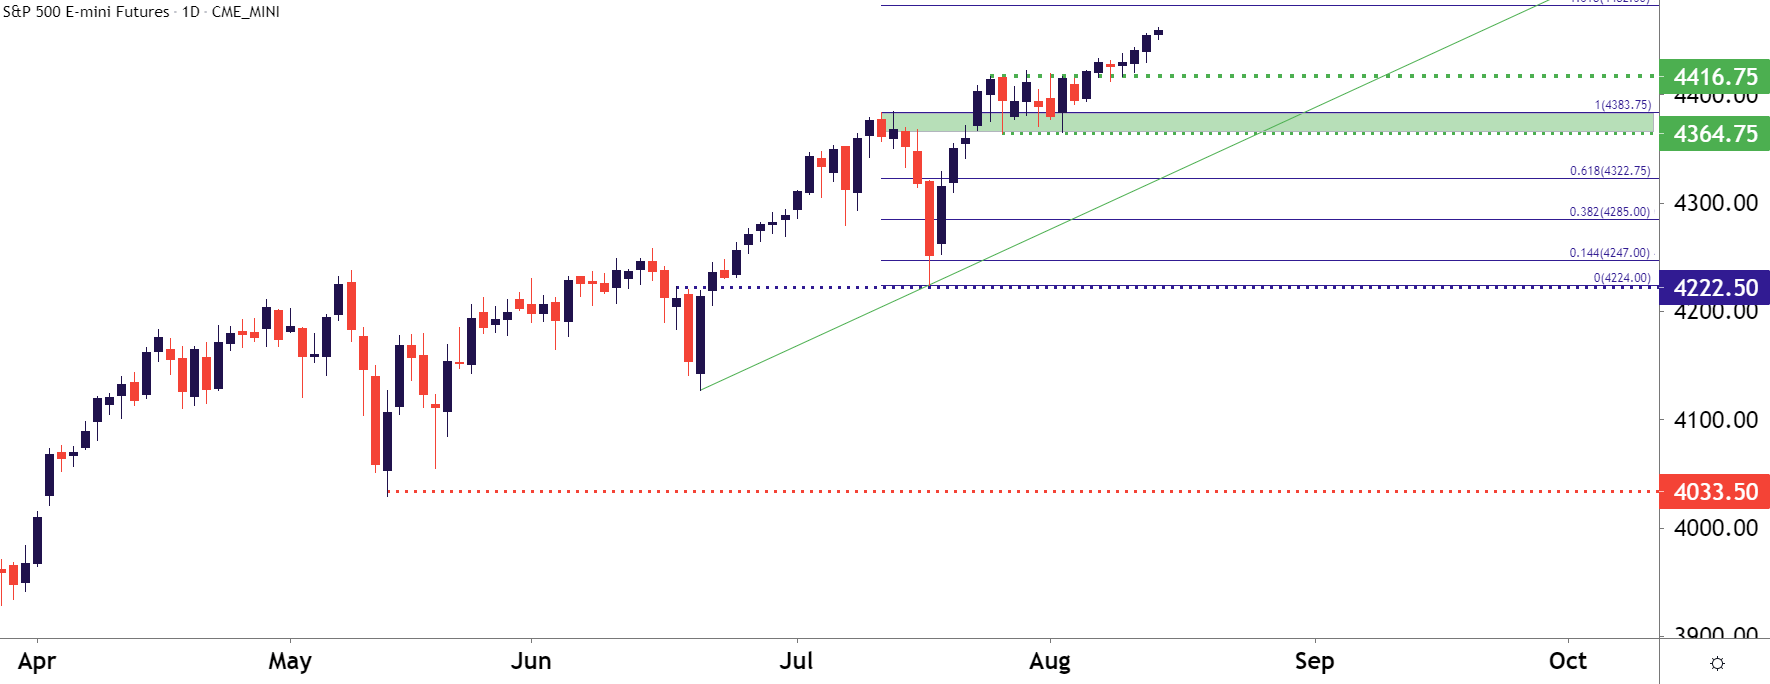
Chart prepared by James Stanley; S&P 500 on Tradingview
--- Written by James Stanley, Senior Strategist for DailyFX.com
Contact and follow James on Twitter: @JStanleyFX


