


Dow Jones index Technical Forecast: Bearish
- The Dow Jones saw a “Triple Top” pattern forming on the daily chart
- This may be a warning sign of a deeper pullback if prices breach pattern support
- Bearish MACD divergence hints at weakening momentum

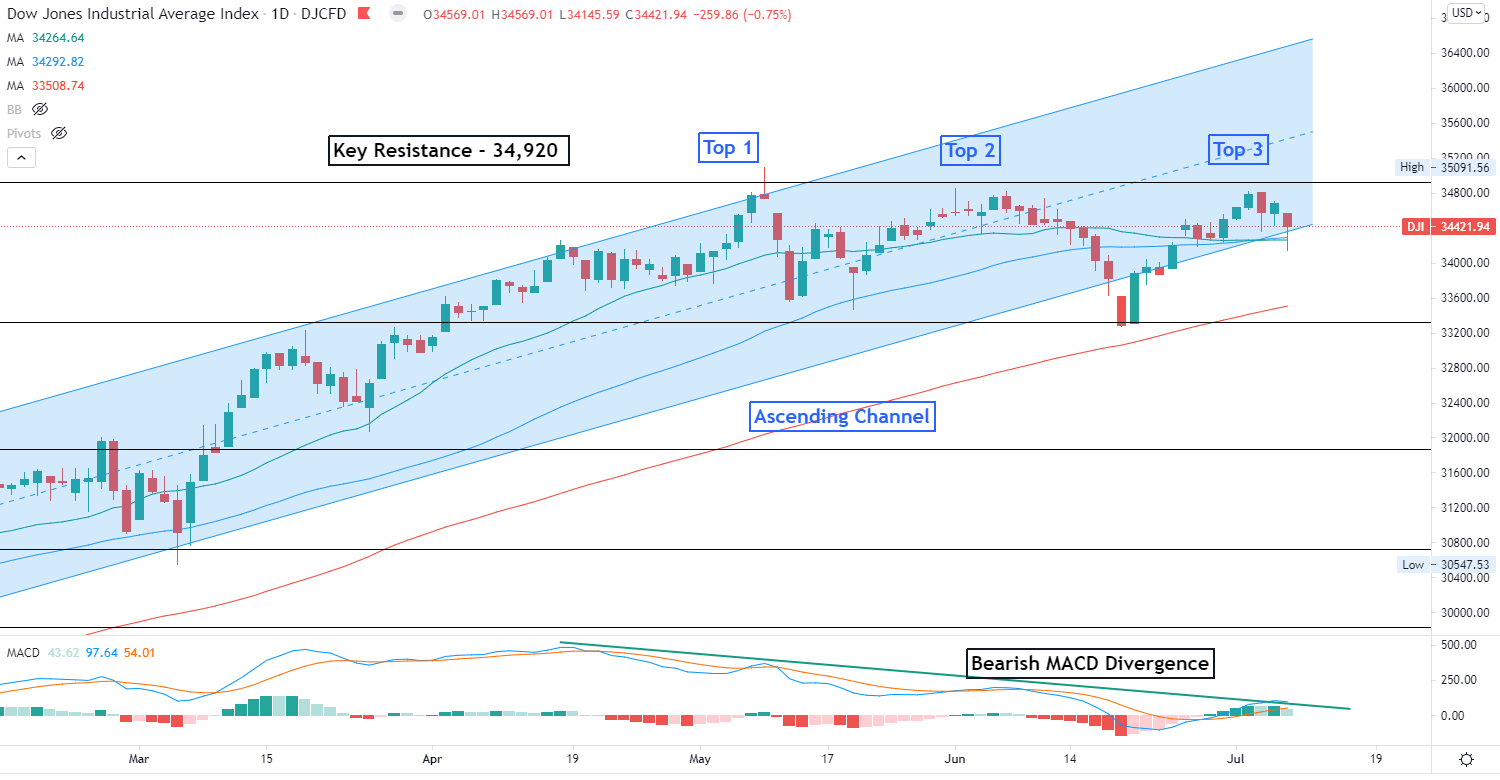
Chart by TradingView
The Dow Jones Industrial Average pulled back from record highs towards the weekend. The benchmark failed to breach a key resistance level at 34,920 for a third try, leading to the formation of a “Triple Top” chart patten (chart above).
A “Triple Top” pattern is a strong bearish trend-reversal indicator that usually occurs at the peak of an uptrend. It is formed by three adjacent peaks in the same price area, with small pullbacks in between. The area of the peaks may be viewed as strong resistance, as the underlying asset is not able to attract enough buyers above the level. For the Dow Jones, 34,820- 34,920 may serve as a strong resistance zone where the peak area was found.
The lows of the pullbacks form a trendline, which may be viewed as immediatesupport. A “Triple Top” pattern is completed when prices breach below the trendline. For the Dow Jones, the previous swing low at 33,320 may be viewed as an immediate support level, ahead of challenging the trend’s bounds.
The index was trending higher within an “Ascending Channel” formed since November. It is testing the floor of this channel, breaking which may set the stage for further losses.
Bearish MACD divergence also suggests that upward momentum may be faltering, rendering the index vulnerable to a deeper correction if selling pressure builds.

--- Written by Margaret Yang, Strategist for DailyFX.com
To contact Margaret, use the Comments section below or @margaretyjy on Twitter


