- Australian Dollar updated technical trade levels – Monthly, Weekly Chart
- Break below yearly opening-range could put bearish tilt heading into Q3
- Focus key support into 74-handle – Riskis lower while below the yearly open
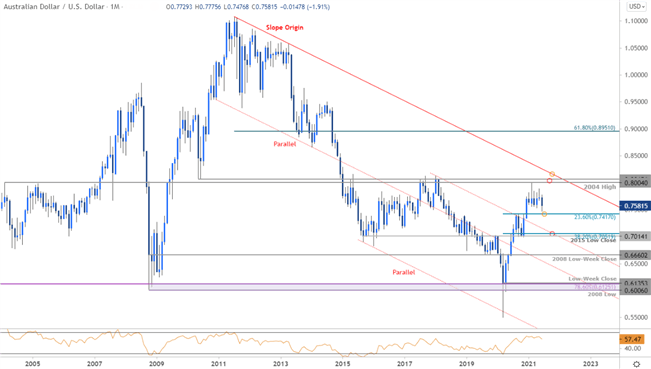
Heading into the second quarter, our forecast highlighted that Aussie had failed a stretch into critical resistance at 8004/65- a region defined by the 2004 swing high, the 2010 low and the 2017/2018 close highs. AUD/USD continued to hold a well-defined yearly opening-range into June before collapsing more than 6.6% off the yearly highs.
AUD/USD Price Chart– Monthly Timeframe

Source – Trading View; Prepared by Michael Boutros
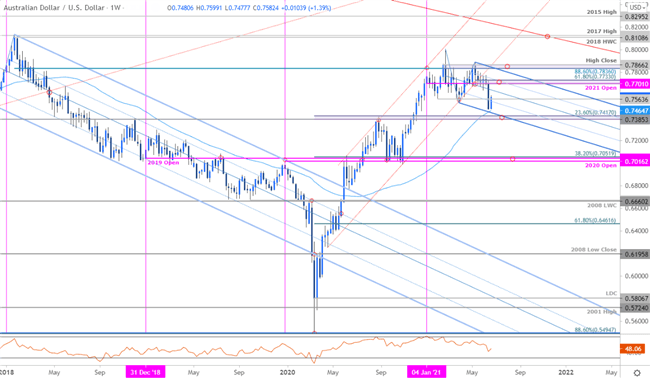
Building weekly momentum divergence into the yearly highs continues to highlight the threat for a deeper Aussie pullback heading into the close of June trade. Initial weekly support eyed at the May 2017 low-week close / 23.6% Fibonacci retracement of the 2020 rally at 7385-7417. A break / monthly close below would be needed to keep the immediate downtrend viable towards key support at the 2015 low-close / 38.2% retracement at 7014/52- and area of interest for possible downside exhaustion IF reached.
Gold Price Chart – Weekly Timeframe

Source – Trading View; Prepared by Michael Boutros
A closer look at the weekly chart shows Aussie breaking below the April 2020 channel line with the decline trading within the confines of a newly identified descending pitchfork formation extending off the yearly highs. Initial resistance stands back at the objective 2021 yearly open / 61.8% retracement of the May decline at 7701/33 with broader bearish invalidation lowered to the yearly high-close at 7866.
Bottom line: Australian Dollar threatened a break below the yearly opening-range into the close of June and we’re on the lookout for an exhaustion low heading into the third quarter. From a trading standpoint, look to reduce short-exposure / lower protective stops on a stretch towards the 74-handle – and look for a reaction there for guidance. Rallies should be capped by the upper parallel IF Aussie is indeed heading lower on this break.


