


AUD/USD Technical Forecast: Bullish
- AUD/USD recaptures 200-day Simple Moving Average
- Trendline resistance from May high shifting into focus
- MACD and RSI oscillators point to increasing momentum

The Australian Dollar has been on a wild ride throughout the past few weeks against the US Dollar, rising back above its 200-day Simple Moving Average after sinking below the key level just the week prior. AUD/USD has now recaptured a level of former support via a prior neckline that made up a Head and Shoulders pattern.
Despite a five day consecutive gain last week, AUD/USD has not recovered the prior week’s big move lower after the FOMC decision supercharged the US Dollar. However, the week ahead may carry forward the bullish energy, especially considering the move back over the 200-day SMA likely inspired some confidence among Aussie Dollar bulls.
Should the currency pair continue tracking higher this week, a descending resistance trendline stemming from the May swing high will shift into focus. The former neckline support area along with the 200-day SMA may offer support to the downside. If those levels fail, however, bulls may quickly surrender, and price could see an accelerated drop.
The Moving Average Convergence Divergence (MACD) oscillator is pointing higher, with a potentially bullish signal approaching as the MACD line looks to cross above its signal line. The Relative Strength Index (RSI) is also looking higher after extending up from oversold conditions last week. Overall, AUD/USD’s technical posture has improved, but downside risks remain.
AUD/USD Daily Chart
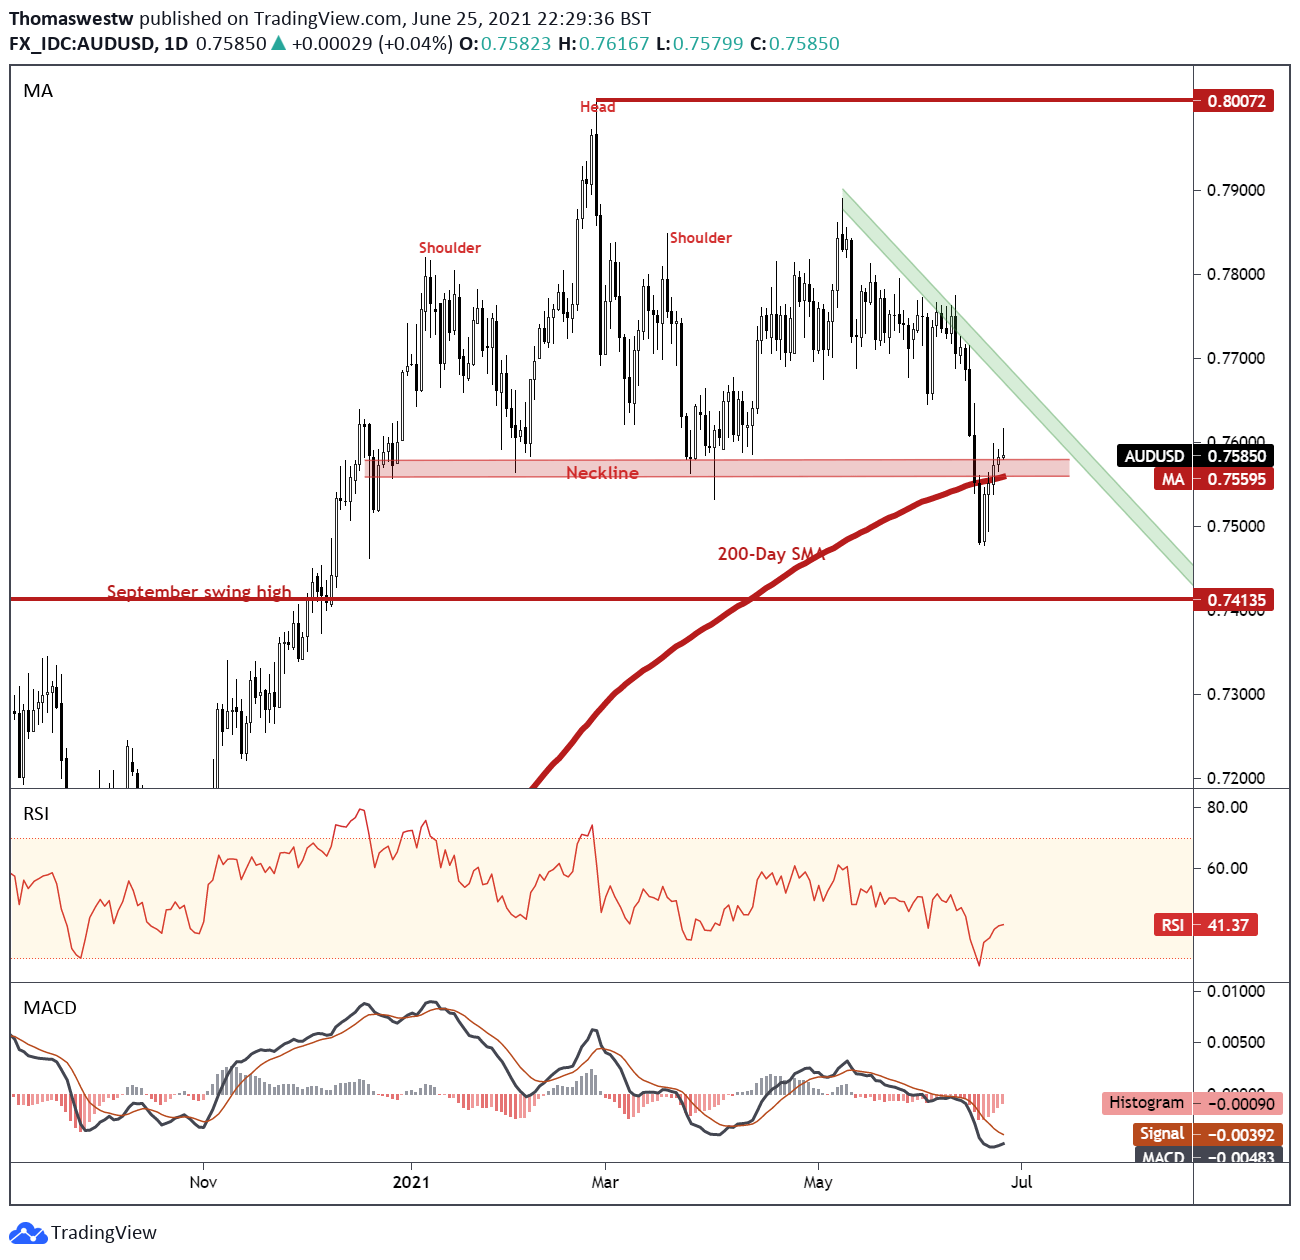
Chart created with TradingView
AUD/USD TRADING RESOURCES
- Just getting started? See our beginners’ guide for FX traders
- What is your trading personality? Take our quiz to find out
- Join a free webinar and have your trading questions answered
- Subscribe to the DailyFX Newsletter for weekly market updates
--- Written by Thomas Westwater, Analyst for DailyFX.com
To contact Thomas, use the comments section below or @FxWestwater on Twitter


