


Nasdaq 100 index Technical Forecast: Bullish
- The Nasdaq 100 index has likely formed a “Double Bottom” following a bearish Gartley pattern
- This may be a bullish signal and could lead the way to test its all-time high of 14,073
- The Hang Seng Index (HSI) entered another technical correction as it failed to breach the neckline of the “Double Bottom” chart pattern

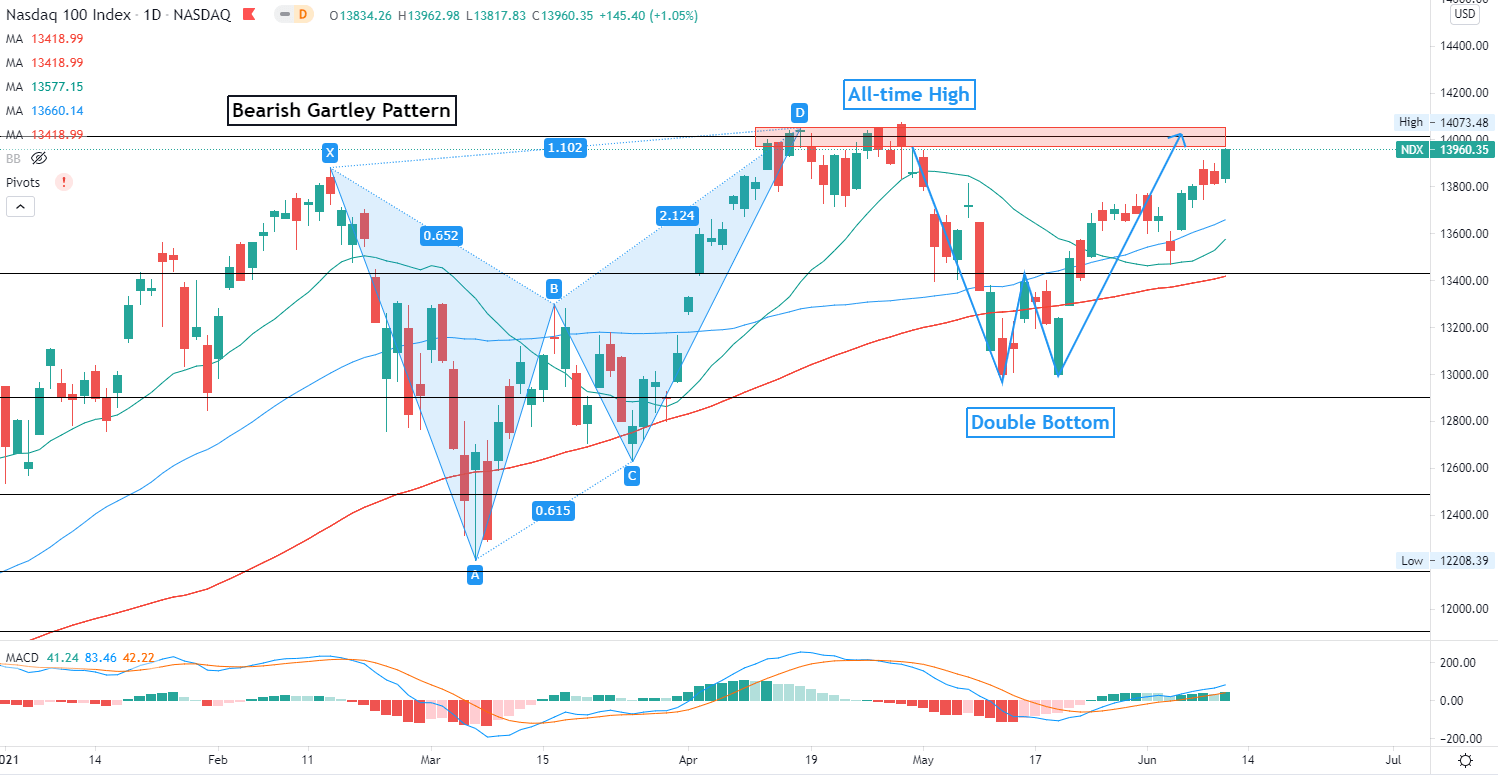
Chart by TradingView
The Nasdaq 100 index is aiming to challenge all-time highs at around 14,070, which is also near the 200% Fibonacci extension level. The index pulled back in late-April after hitting this level, suggesting that strong selling pressure may be seen as prices edge higher.
A successful attempt would likely intensify near-term buying power and carve a path for prices to move higher towards 14,200 and then 14,400. A failed try however, may lead to another technical pullback with an eye on the 100-day SMA line for support.
The index is riding an upward trend after forming a “Double Bottom” chart pattern. A “Double Bottom” is usually found at the end of a downtrend and resembles the letter “W”, as highlighted in the chart above. It serves as a popular bullish reversal signal, suggesting that the consolidation phase following the bearish “Gartley” pattern has come to an end.
The “Double Bottom” pattern may pave the way for the Nasdaq 100 to retest its all-time highs. The overall trend remains bullish-biased, as suggested by the upward-sloped SMA lines. The MACD indicator breached above the neutral midpoint and trended higher, underscoring upward momentum.
Hang Seng Index – Daily Chart
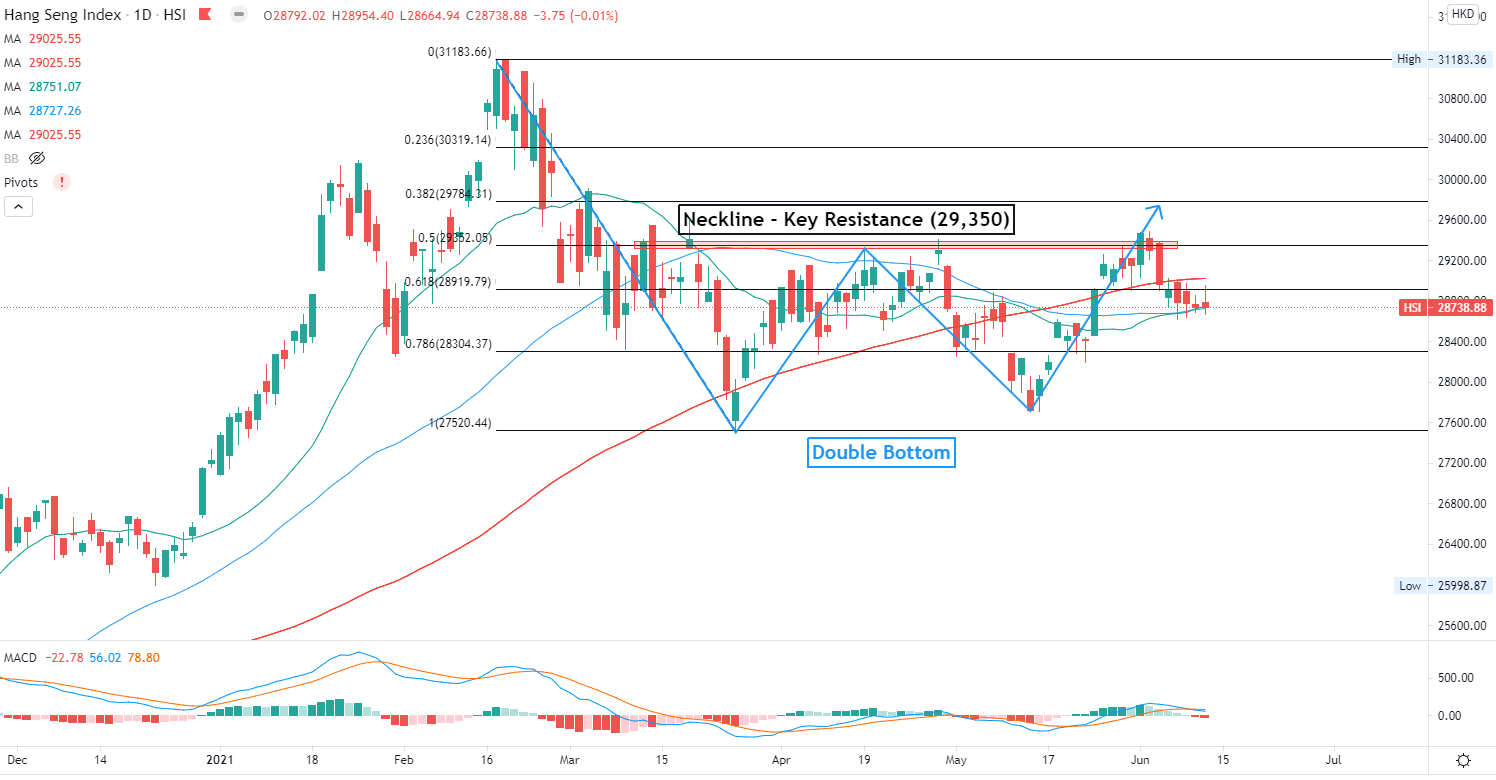
Chart by TradingView
The Hang Seng Index (HSI) has been in a consolidative period since mid-February, down 7.9% from its recent peak. The index also formed a “Double Bottom” pattern recently, but the upward momentum appears to be faltering. Prices failed to breach the “neckline” of the “Double Bottom” pattern and has since pulled back. This could potentially invalidate the pattern and opens the door for further losses. The index is likely to range bound between 28,300 to 29,350 waiting for fresh catalysts to set a clearer direction.
The MACD indicator formed a bearish crossover and trended lower, suggesting that bearish momentum may be building.

--- Written by Margaret Yang, Strategist for DailyFX.com
To contact Margaret, use the Comments section below or @margaretyjy on Twitter


