


Nasdaq 100 index Technical Forecast: Bullish
- The Nasdaq 100 index has likely entered a minor correction, but the medium-term bull trend remains intact
- A bullish inverse “Head and Shoulders” chart pattern remains in focus despite a short-term pullback
- Further development of the “H&S” formation may hint at further price gains with an eye on 14,386

The Nasdaq 100 index entered a brief consolidation period after rallying 11.3% from end-March to mid-April. The index’s rally appears to be taking a pause as profit-taking kicked in, allowing buyers and sellers to change hands. The overall trend remains bullish-biased as suggested by upward-sloped 50- and 100-day SMA lines.
A typical inverse “Head and Shoulders” (“H&S”) pattern was formed during mid-February to early April when the Nasdaq 100 entered a technical correction. This can be a strong bullish trend-reversing indicator and is typically formed when a downtrend is depleted and about to turn around. The benefit of using a H&S setup is that it defines areas to set stop-loss and profit-taking levels.
A general rule of thumb suggests that the low point of the “right shoulder” will specify the stop level whilst the vertical distance between the neckline and the peak of the “head” will approximate the distance to the upside objective – 1,085 points in this case. A completed inverse “Head and Shoulders” may pave the way for the Nasdaq 100 index to challenge 14,386 – a level generated by adding 1,085 points to the neckline. 14,386 is very close to the 161.8% Fibonacci extension level (14,361), where some selling pressure may be found.
Nasdaq 100 Index – Daily Chart
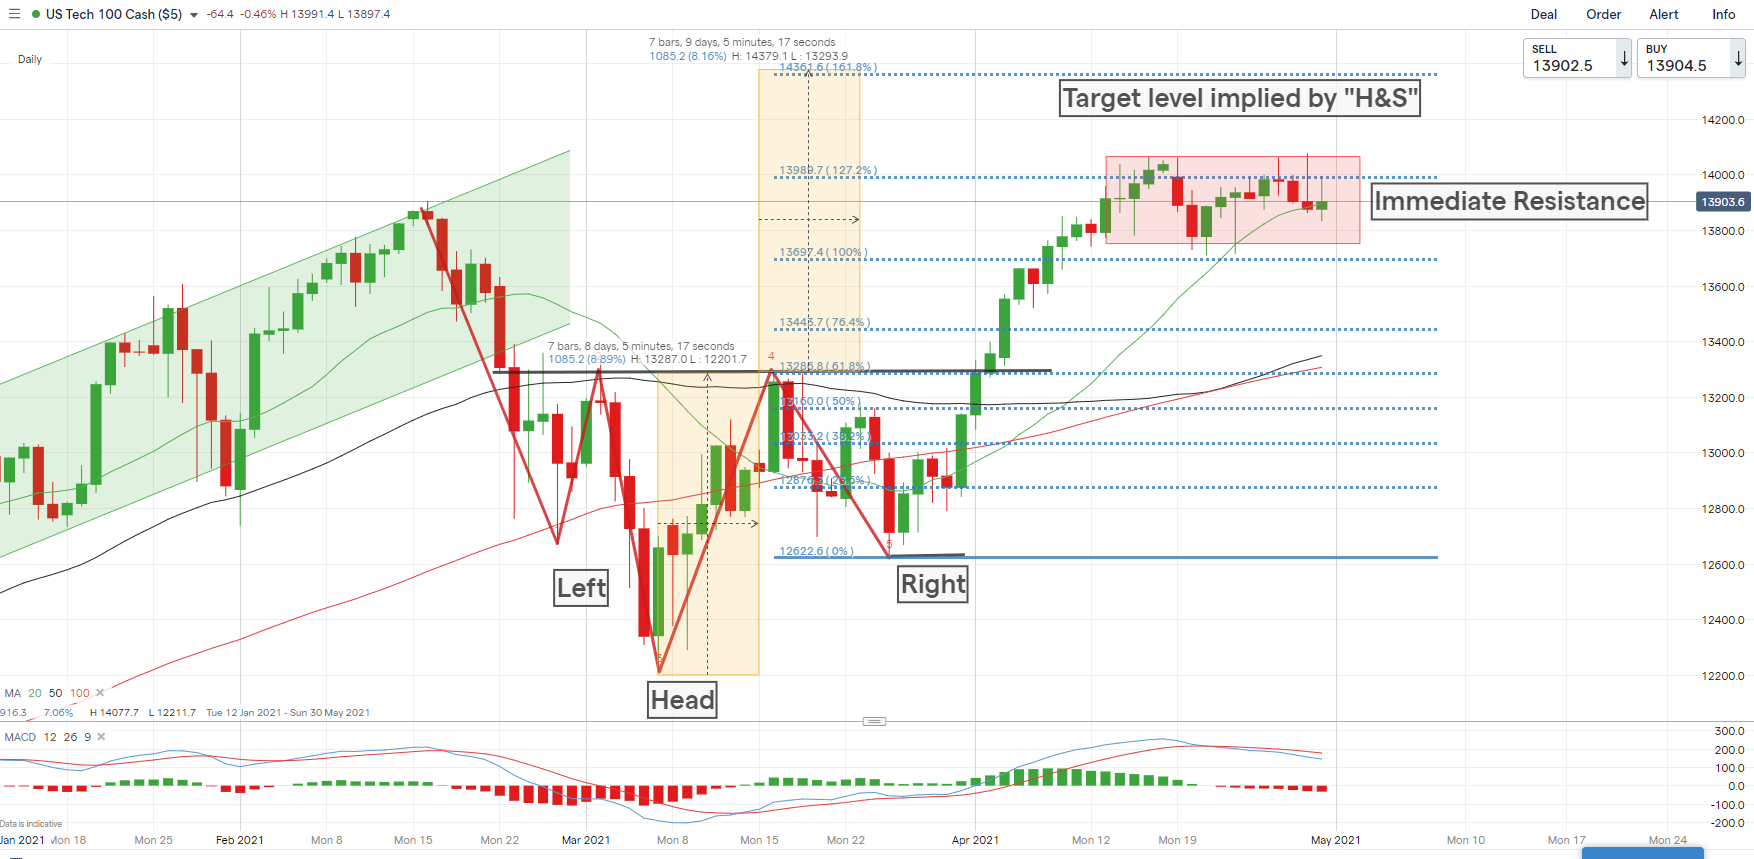
Chart by IG
The index’s 20-day SMA line surged substantially higher above the 50- and 100-day SMA lines, underscoring the need for a short-term correction. An immediate resistance zone can be found between 13,990 (the 127.2% Fibonacci extension) and 14,070 (recent highs). The 20-day SMA line may serve as an immediate support level. A breach below it may lead to further losses with an eye on 13,697 (the 100% Fibonacci extension) for support.
The MACD indicator is trending lower after forming a bearish crossover, suggesting that upward momentum might be fading.
On the weekly basis, the Nasdaq 100 index has returned to its primary uptrend after a brief technical pullback. The trend-defining 10-period SMA line has flipped upward, suggesting that near-term path has turned bullish. A Fibonacci extension points to a key resistance level at 14,285 - the 61.8% mark – if price can hold above the 50% extension (13,598).
Nasdaq 100 Index – Weekly Chart
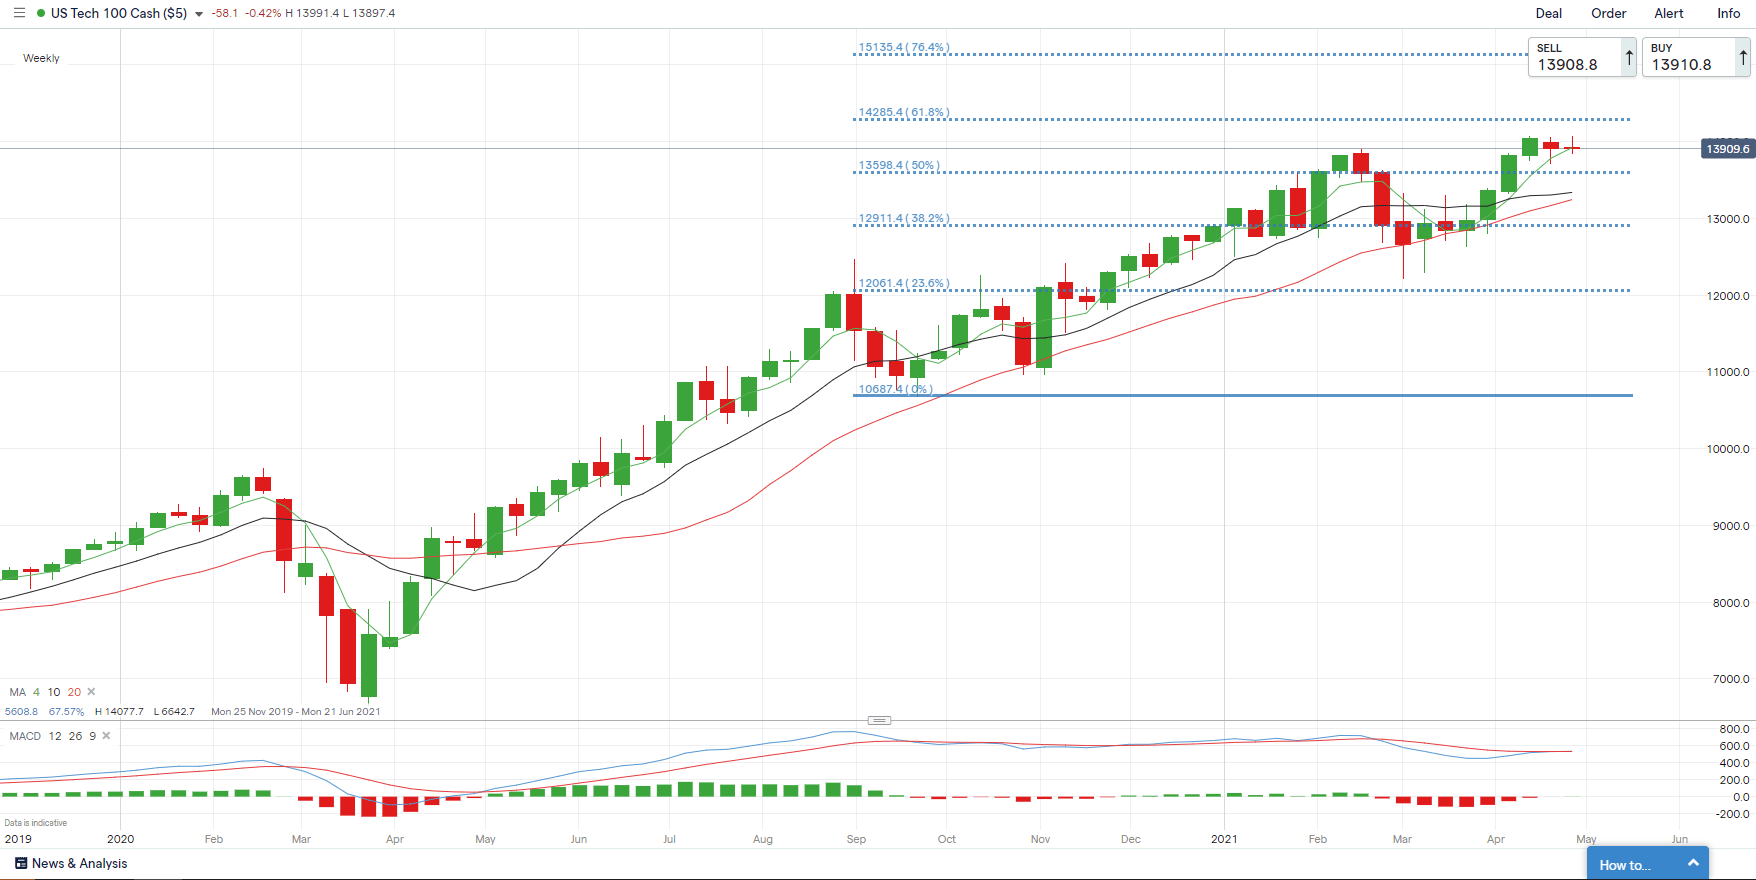
Chart by IG

--- Written by Margaret Yang, Strategist for DailyFX.com
To contact Margaret, use the Comments section below or @margaretyjy on Twitter


