


Gold Technical Outlook: Bullish
- Gold prices look set to extend recent gains, after bouncing back above key psychological resistance.
- The longer-term outlook remains skewed to the upside as prices carve out a Bull Flag continuation pattern.
Gold prices have rebounded robustly higher in recent days, after bouncing off of key technical support and accelerating back above pivotal psychological resistance. Here are the key levels to watch for gold in the coming weeks.
Gold Price Weekly Chart – Bull Flag Pattern Hints at Long-Term Upside
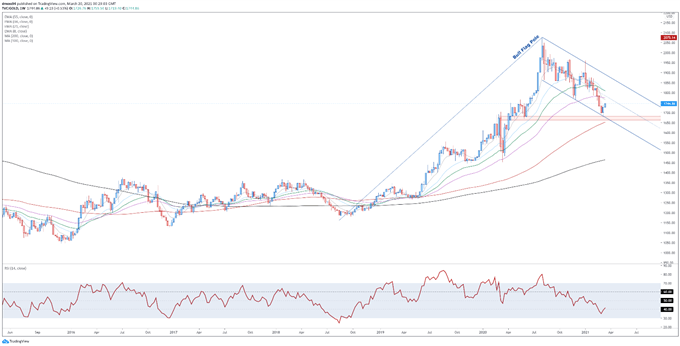
Gold price weekly chart created using Tradingview
The long-term technical outlook for gold remains constructive, as prices carve out a Bull Flag continuation pattern and remain positively positioned above the 100-, and 200-period moving averages.
Indeed, with the RSI climbing back above 40, after falling to its lowest levels since September 2018, a more extended rebound higher seems on the cards.
Ultimately, a weekly close back above 1750 is needed to validate bullish potential, and pave the way for the anti-fiat metal to probe the trend-defining 55-EMA (1774).
On the other hand, if 1750 holds firm, prices may slide back towards the yearly low (1677).
Gold Price Daily Chart – 8-EMA to Nurture Uptrend
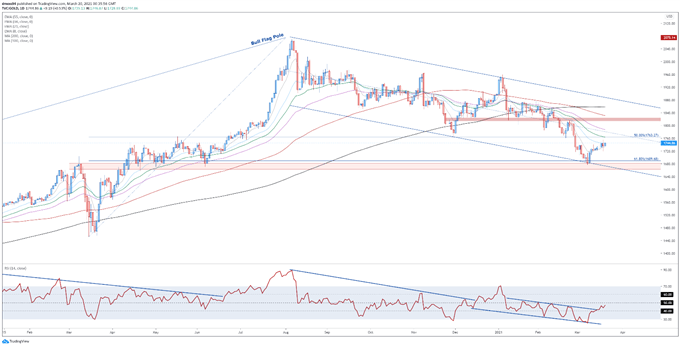
Gold price daily chart created using Tradingview
Zooming into the daily chart reinforces the bullish outlook depicted on the weekly timeframe, as prices climb back above psychological resistance at 1740.
With the RSI breaking its yearly downtrend, and the slopes of the shorter-term moving averages notably turning higher, the path of least resistance seems skewed to the topside.
A daily close above the March 18 high (1755) would probably intensify buying pressure, and bring former support-turned-resistance at the 50% Fibonacci (1763) into the crosshairs.
Clearing that carves a path for bulls to challenge the 1800 mark. However, a break back below 1740 could neutralize near-term buying pressure and generate a reversal back towards 1700.
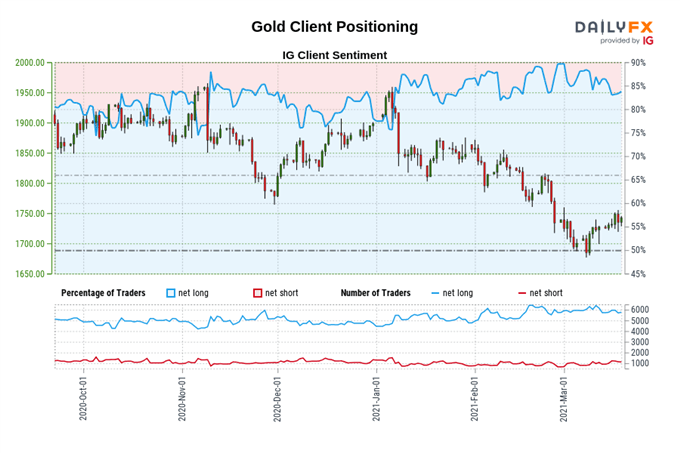
The IG Client Sentiment Report shows 82.85% of traders are net-long with the ratio of traders long to short at 4.83 to 1. The number of traders net-long is 3.26% lower than yesterday and 3.52% lower from last week, while the number of traders net-short is 13.90% higher than yesterday and 18.12% higher from last week.
We typically take a contrarian view to crowd sentiment, and the fact traders are net-long suggests Gold prices may continue to fall.
Yet traders are less net-long than yesterday and compared with last week. Recent changes in sentiment warn that the current Gold price trend may soon reverse higher despite the fact traders remain net-long.
-- Written by Daniel Moss, Analyst for DailyFX
Follow me on Twitter @DanielGMoss


