


US Dollar Technical Forecast: Bearish
- It was a big week for US Dollar bears as the currency pushed down to a fresh two-year-low, breaking below a number of support levels in the process.
- Can the move hold? Next week’s ECB rate decision is huge for this theme.
- The analysis contained in article relies on price action and chart formations. To learn more about price action or chart patterns, check out our DailyFX Education section.
It was a brutal week in the Greenback as the US Dollar dropped by as much as 1.71%. But, perhaps more pertinent than the size of the move itself was where it took place on the chart, as the US Dollar pushed through a number of support levels along the way while selling-off this week.
Perhaps most interestingly, we haven’t even gotten word of that stimulus deal that everyone seems to be waiting on. As US equities posture near all-time-highs, even with optimism driven by Covid vaccines, confirmation of a stimulus program continues to wait as Congress volleys details of how that program might ultimately look.
But, that impasse seemed to matter little this week in the US Dollar as the currency put in an outsized bearish move on its way down to fresh two-year-lows. Prices finally found a bit of support on Thursday trade, and that support held into the weekend. This comes from the price of 90.49, and this is the 14.4% Fibonacci retracement of the 2017-2018 major move. The big question is for how long might this hold, as sellers were extremely aggressive early in the week and it doesn’t look as though there are many factors of favor for USD-bulls at the moment.
US Dollar Weekly Price Chart: Support Appears After a Tumultuous Fall
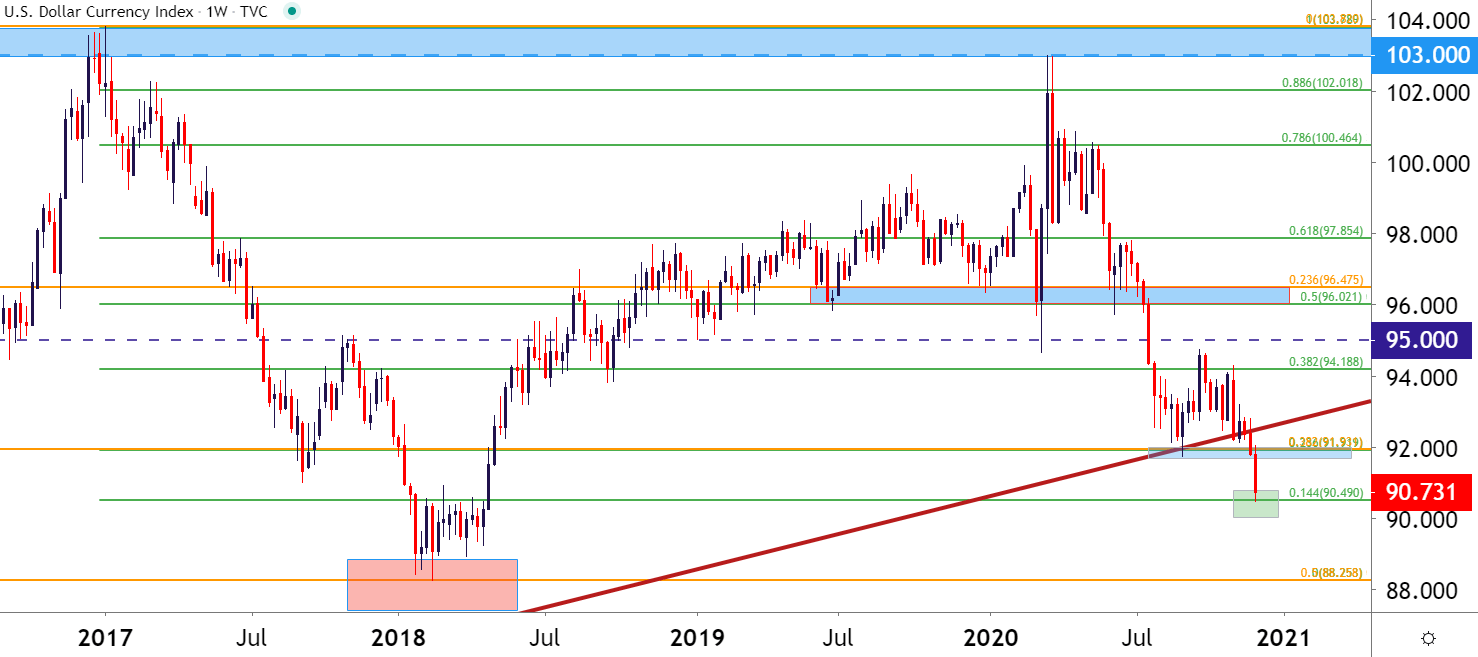
Chart prepared by James Stanley; USD, DXY on Tradingview
EUR/USD Breaks Above 1.2000 Psychological level
If there’s going to be a wicked reversal scenario in store for FX markets next week, this might be one of the more likely spots for it to show. The European Central Bank has a rate decision on Thursday and it’s long been expected that the ECB will increase their stimulus program at this meeting. But there’s also considerable speculation that the bank may not have much ammunition left in the artillery, at least not enough to keep up with the breakneck pace out of the US; and this week’s price action is somewhat of a nod to that as buyers finally pushed the EUR/USD pair through a huge zone of resistance around the 1.2000 handle.
Perhaps what’s most impressive is what happened after that 1.2000 break; in the fact that EUR/USD just kept running until a fresh two-year-high was set at 1.2178. While this appears a decisive break on the technical front, the big item of concern would be whether the ECB does, in fact, have enough firepower stored up to elicit another wave of Euro weakness at next week’s rate decision.
On a purely technical basis, however, this is a bullish chart and keeps the door open for continuation potential. The prior point of resistance, around the 1.2000 handle, can now be re-assigned as support potential.
| Change in | Longs | Shorts | OI |
| Daily | 1% | -5% | -2% |
| Weekly | 9% | 5% | 7% |
EUR/USD Daily Price Chart
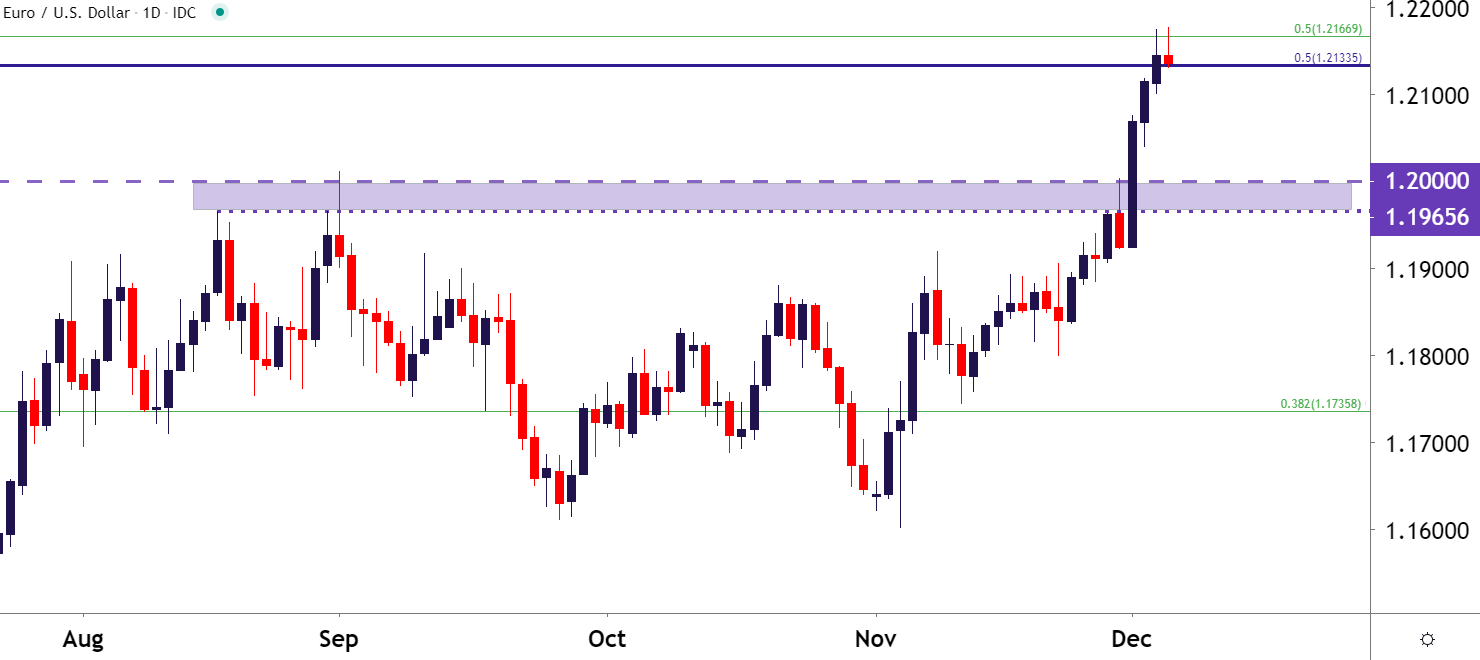
Chart prepared by James Stanley; EUR/USD on Tradingview
GBP/USD Flickers to Two-Year-Highs, Finds Resistance at a Familiar Level
The level of 1.3500 has some historical pull in GBP/USD. This level came into play around the Brext referendum now more than four years ago. It helped to soften the sell-off on the night of Brexit and became a point of lower-high resistance as the post-Brexit sell-off was taking hold. But, this same price of 1.3500 also helped to mark the two-year-high coming into this week, capping the advance in late-2019 before prices plunged in February and early-March.
And then in September, as a combo of Brexit optimism and USD-weakness was in-play, GBP/USD was marching up for another test of 1.3500 before buyers all-of-the-sudden got bashful, stopping short ahead of the psychological level before another three-week sell-off.
To learn more about psychological levels, join us in DailyFX Education
That level came back into play again this week and, similarly, helped to cap the advance in the pair. We did, however, make a technical two-year-high; the bigger item of contention is whether market participants think that this is finally the time when Cable can breach the big figure.
As discussed by our own Justin McQueen, Brexit optimism is running high and this, combined with the potential for even more USD-weakness, keeps the door open for topside breakout potential in the pair going into next week.
| Change in | Longs | Shorts | OI |
| Daily | -6% | 6% | -1% |
| Weekly | 13% | 4% | 9% |
GBP/USD Daily Price Chart
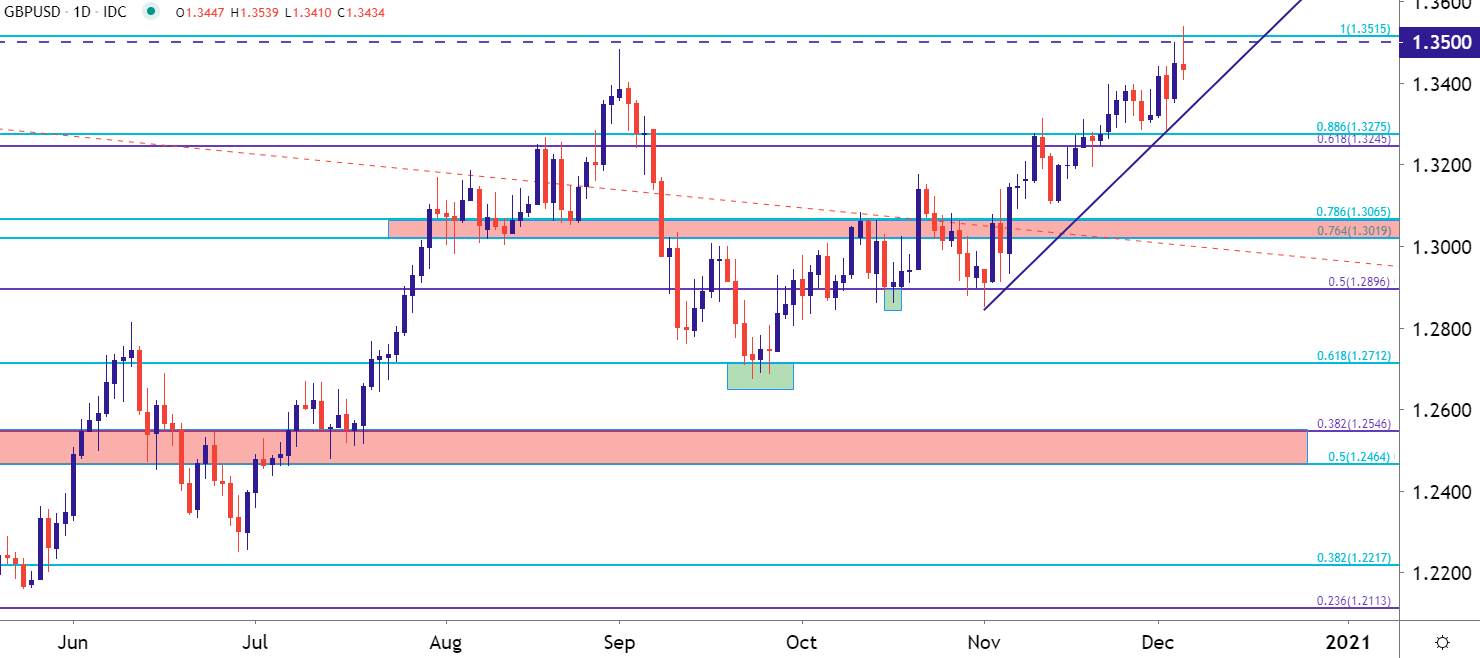
Chart prepared by James Stanley; GBP/USD on Tradingview
AUD/USD Joins the Party
After a slow start to the week, Aussie bulls got back on the bid, helping to drive AUD/USD up to its own fresh two-year-high. And, similar to both EUR/USD and GBP/USD above, which were previously battling with big figures that had shown at resistance, a big figure lurks nearby as resistance potential.
The difference here is notable, however, as the 1.2000 spot in EUR/USD showed as resistance in early-September (and again on Monday) before finally being taken-out this week. The 1.3500 spot in GBP/USD was in-play at the end of last year, and almost in-play a few months ago. In both of those areas, resistance was softened a bit by prior tests; but in AUD/USD, prices haven’t yet been back to the .7500 big figure that looms ahead, and this can keep the door open for reversal potential in the pair, particularly for those that are looking to fill-in a possible venue for USD-strength, if it is to show.
| Change in | Longs | Shorts | OI |
| Daily | -1% | 1% | 0% |
| Weekly | 25% | -2% | 11% |
AUD/USD Weekly Price Chart

Chart prepared by James Stanley; AUD/USD on Tradingview
USD/CAD Crushes Through Huge Support
Over the past couple of years there’ve been multiple support tests around the 1.3000 spot on USD/CAD. Last week finally brought a weekly close below this price, but sellers appeared cautious as we were still holding above he 1.2952 level that helped to set the low around the start of this year.
Friday, however, helped to bring sellers into play with motivation as a poor US NFP report was released the same time as a strong Canadian jobs report; allowing for USD-weakness to go along with CAD-strength to push for a really big move in the pair.
USD/CAD continued its slide all the way into the 1.2783 level, which helped to set the low back in October of 2018. At this point, the fresh breakout in USD/CAD appears to be a decisive push by bears, and the door can remain open to bearish scenarios. The complication here is likely one of timing, as selling a fresh low can be an aggressive way of going about matters: But – that big area of prior support now becomes resistance potential, and a test here could quickly open the door for bearish continuation strategies in USD/CAD.
| Change in | Longs | Shorts | OI |
| Daily | 20% | -12% | 2% |
| Weekly | 14% | 2% | 8% |
USD/CAD Weekly Price Chart

Chart prepared by James Stanley; USD/CAD on Tradingview
--- Written by James Stanley, Strategist for DailyFX.com
Contact and follow James on Twitter: @JStanleyFX


