


Dow jones index Technical Forecast: Bearish
- The Dow Jones index hit an all-time high of 29,933 before entering into a period of consolidation
- The index may eye a key support level at 28,000 – the 20- and 50-Day Simple Moving Averages (SMAs)
- The medium-term trend remains bullish-biased, although a near-term pullback appears to be likely
The Dow Jones Industrial Average index reached its all-time high of 29,933 on November 9th and entered a consolidative periodsince. The index appeared to have been temporarily overbought after surging more than 14% during the first six trading days in November, rendering it vulnerable to a technical pullback when profit taking activities kick in.
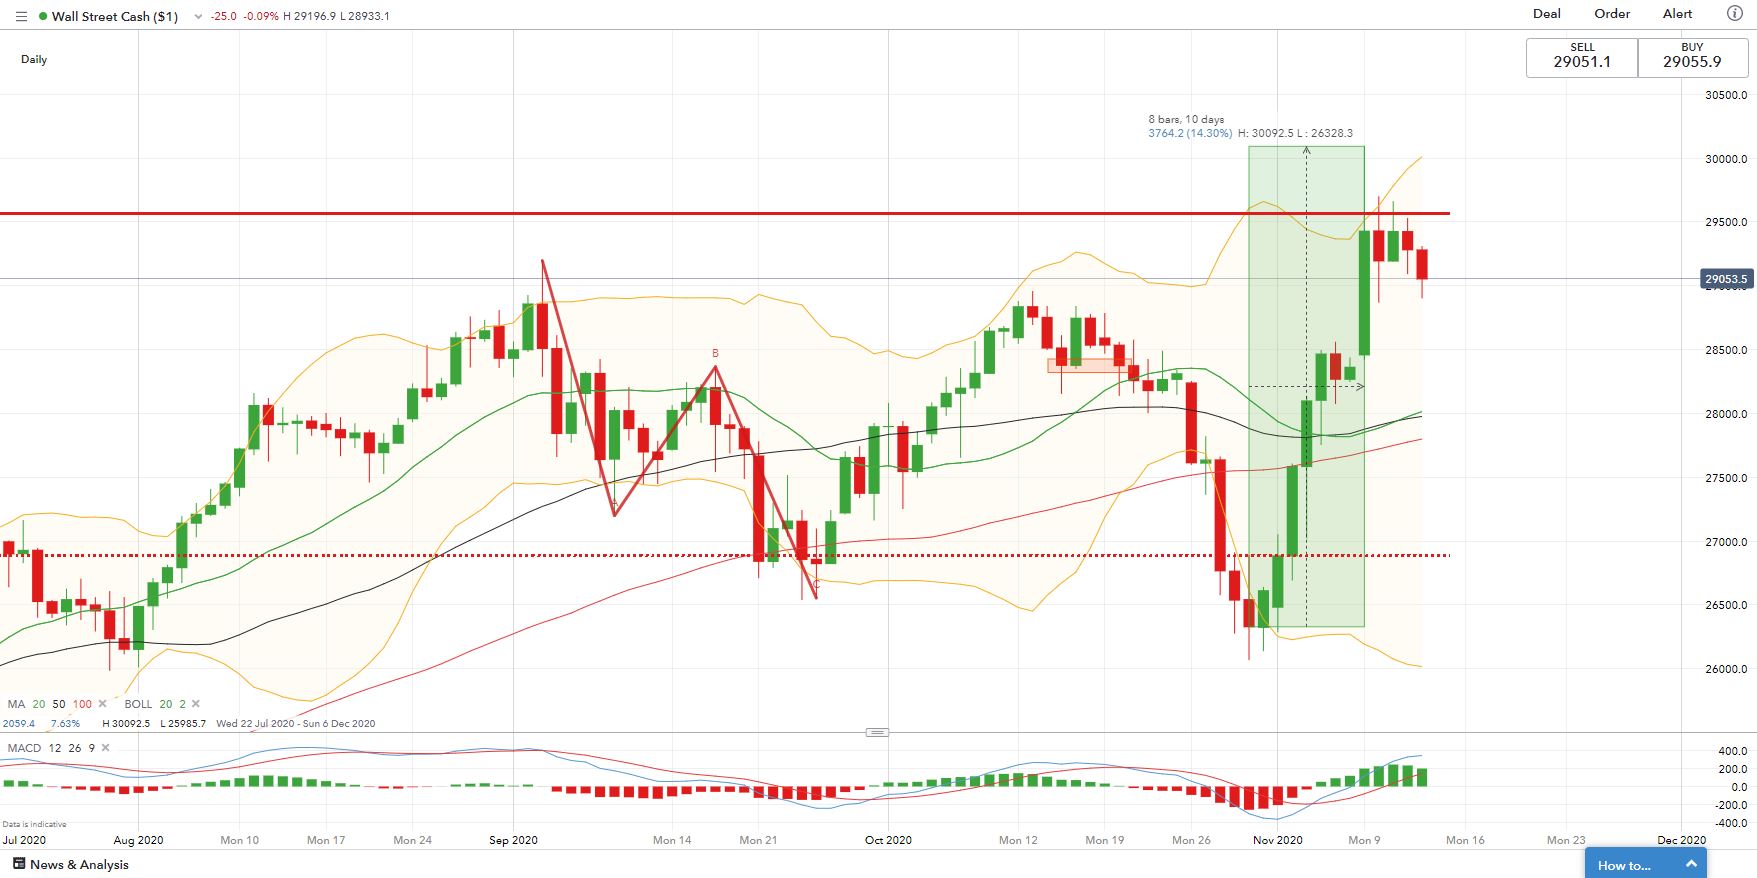
Dow Jones has also hit a key resistance level of 29,570 – the previous high last seen in February. Failing to break this level may lead to a further pullback, with an eye on the 28,000 figure where the 20- and 50-Day Simple Moving Average (SMA) lines overlap. In the event that the index breaks below 28,000, it may open the door for further losses towards the next support level at 26,860 – the 76.4% Fibonacci retracement.
Bollinger Band width has widened recently, reflecting heightened volatility. The price turned lower after hitting the indicator’s upper band, which is usually perceived as a dynamic resistance level. Near-term momentum appears biased towards the downside, as suggested by a flattening MACD indicator.
Dow Jones Index – Daily Chart

On the weekly basis, however, the Dow Jones appears to be taking a pause after registering a whopping 65% gain from March to November (chart below). The overall trend remains bullish-biased, with the recent consolidation potentially paving the way for higher highs. Both the 10- and 20-Week SMA lines are trending higher, suggesting that the medium-term bull trend remains intact.
Further retracement from the current level may result in a “Double Top” pattern on the weekly chart, which may serve as a medium-term bearish indicator.
Dow Jones Index – Weekly Chart


--- Written by Margaret Yang, Strategist for DailyFX.com
To contact Margaret, use the Comments section below or @margaretyjy on Twitter


