


Oil Price Talking Points
The price of oil trades to fresh monthly highs following the failed attempt to test the September low ($36.13), but the 200-Day SMA ($38.75) undermines the advance from the monthly low ($36.63) as the simple moving average continues to track the negative slope from earlier this year.
Technical Forecast for Crude Oil Price: Neutral
The price of oil appears to be on track to test the September high ($43.43) as it extends the advance from the monthly low ($36.63), but the technical outlook is clouded with mixed signals as a ‘golden cross’ formation appeared to take shape in September.
The 50-Day SMA ($48.84) crossed above the 200-Day SMA ($38.75) during the previous month, which fulfills one of one criteria for a bullish signal, but the difference in slope warns of range bound conditions as the simple moving averages start to converge, with the 50-Day failing to preserve the upward trend from earlier this year.
In turn, the price of oil may largely track the September range amid the flattening slope in the 50-Day SMA, while the Relative Strength Index (RSI) appears to be stuck in wedge/triangle formation after dipping into oversold territory during the previous month.
Crude Oil Price Daily Chart
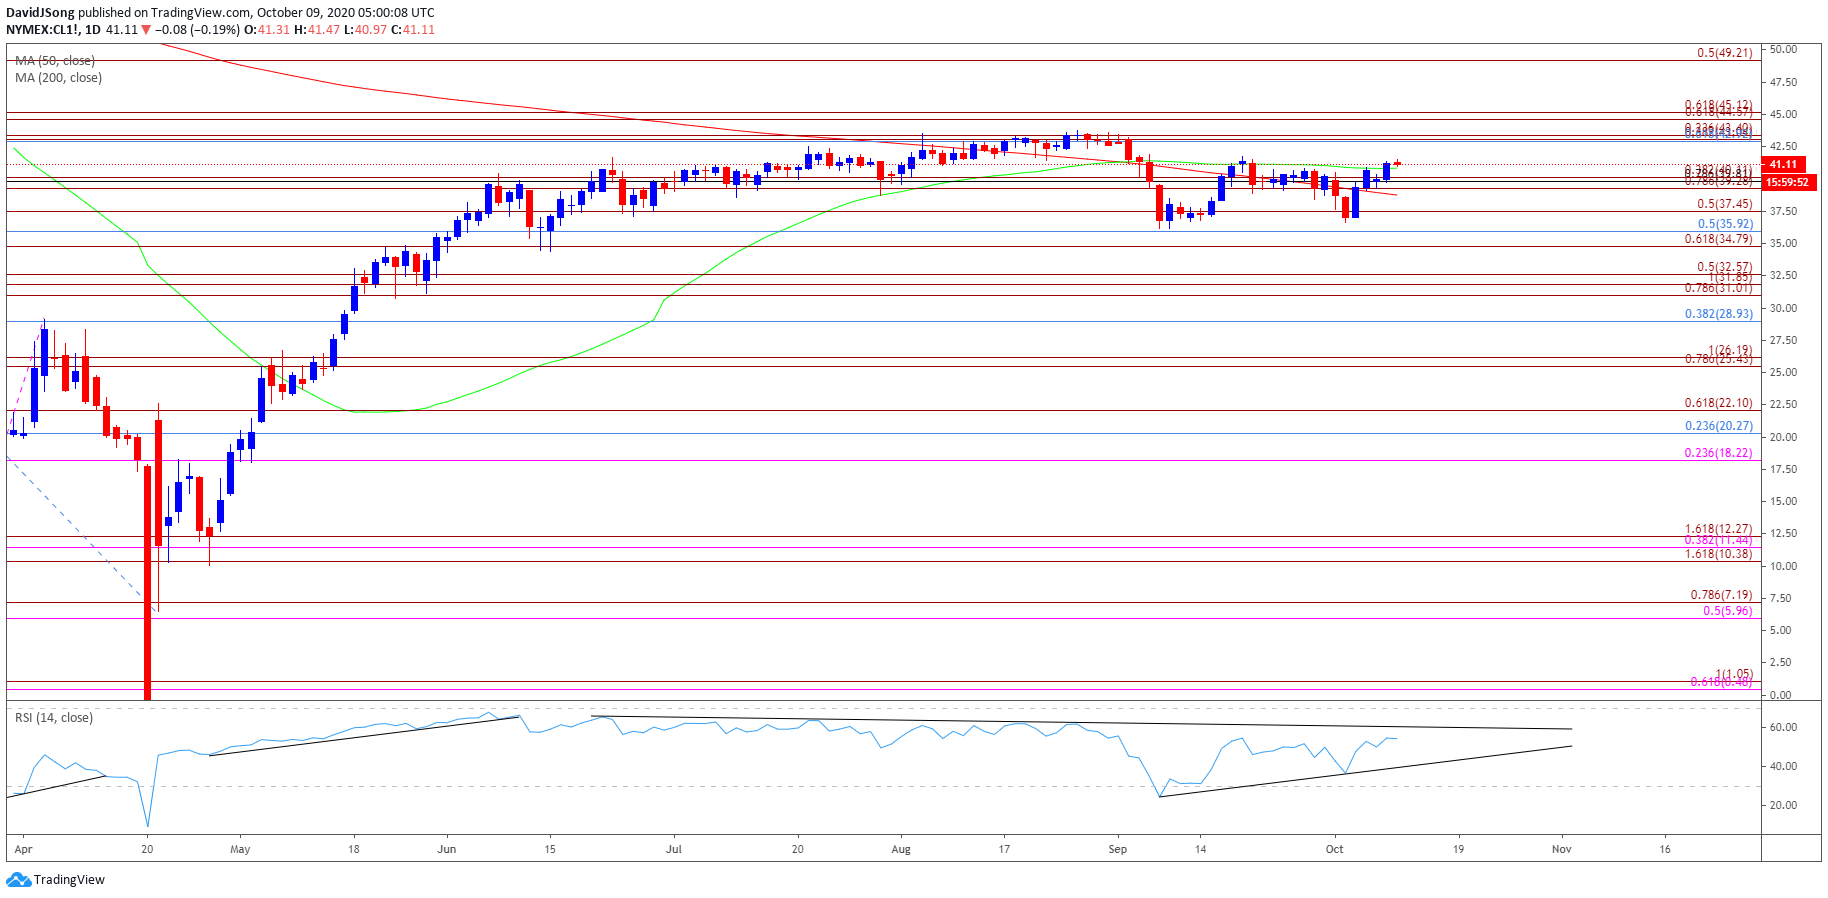
Source: Trading View
The price of oil continues to hold above the Fibonacci overlap around $34.80 (61.8% expansion) to $35.90 (50% retracement) amid the failed attempt to test the September low ($36.13), with the opening range for October raising the scope for higher oil prices as it trades to fresh monthly highs during the first full week.
The move back above the $39.30 (78.6% expansion) to $40.10 (38.2% expansion) area brings the $42.00 (61.8% retracement) to $43.40 (23.6% expansion) region on the radar as it lines up with the September high ($43.43), but oil prices may largely track last month’s range as the Relative Strength Index (RSI) appears to be stuck in a holding pattern.
The wedge/triangle formation in the RSI paired with the flattening slope in the 50-Day SMA ($48.84) offers a more constructive outlook than the downward trend in the 200-Day SMA ($38.75), with crude at risk of facing a ‘death cross’ formation if the 50-Day SMA starts to develop a negative slope.

--- Written by David Song, Currency Strategist
Follow me on Twitter at @DavidJSong


