


Dow Jones, S&P 500, Nasdaq 100 Forecast:
- Stocks caught some selling pressure after a series of strong trends developed through the summer.
- The high-flying Nasdaq put in a strong pullback, with smaller sell-offs seen in the Dow and S&P 500.
- At this stage, we’ve had a couple of days of selling and that doesn’t yet make a new trend, especially with how built-in these bullish trends in equities have become. But – that doesn’t mean that things can’t continue to change as there are a number of risk factors to consider and an 88% gain in an index in less than six months doesn’t feel like a sustainable theme.
- The analysis in this article heavily utilizes price action and chart patterns. To learn more about price action, check out our DailyFX Education section, where it’s taught amongst a host of other candlestick patterns and formations.
Stocks Sell-Off After Smooth Sailing Through the Summer
It was a crude change-of-pace in the middle of this week as a host of new stock traders learned a difficult lesson: Stocks don’t always go up. While this summer’s bullish trend has largely been smooth and fairly clean as prices were jumping-higher, the September open brought a cruel reminder of that fact with a fairly aggressive sell-off showing on Thursday. That sell-off held overnight as markets globally priced-in that sucker punch to stocks, leading into the Friday NFP report, which didn’t appear to be all that bad. But – that selling pressure remained through the US equity open before buyers finally showed up, helping to rally US equities into the weekly close.
This leaves one very important question in front of market participants: What’s the next trend?

The move from the March lows has been outlandish in a number of ways. The Nasdaq has risen by as much as 88% from the March lows – that’s less than six months! The S&P 500 is up by as much as 66% while the Dow put in the weakest showing amongst the three major US equity indices, producing a paltry 60% over the same period of time.
To be sure – there’s a very reasonable explanation for why the bullish trend developed: What’s more difficult to justify is the size of the move given the variables in the fundamental backdrop. With rates being quickly jerked to near-zero in March there was a simple dearth of investment options for fund managers so, naturally, stocks got at least some of that attention when stimulus and market supports had been announced. And as buyers returned, more came back to the table until eventually we were back to where we’d started on the Nasdaq 100 and soon after, the S&P 500.
S&P 500 Pulls Back to Support at Prior ATH
The level of 3,400 appears to be a big one in the S&P 500. This was the area around which price action had topped-out in February. And when the S&P found itself below 2180 a month later, it was difficult to imagine how 3,400 could so soon come back into the equation – but it did in early-August and led to about nine days of consolidation in that bullish trend. Buyers eventually posed another top-side breakout but, until this week, prices hadn’t tested for support around this area of prior resistance.
S&P 500 Daily Price Chart

Chart prepared by James Stanley; SPX500 on Tradingview
Taking a short-term look at the matter, and there’s still the possibility for bearish pressure into next week. The area of focus appears to be around 3485, which is a prior swing-low turned resistance that, at this point, constitutes the most recent ‘lower high.’ If that lower high sticks and buyers don’t test above, then that bearish backdrop opens up a bit more, focusing on support potential around the 3385-3400 zone, after which 3350 comes into play. Beyond that, the next major waypoint appears around 3255, which is the 23.6% Fibonacci retracement of the post-March major move.
S&P 500 Four-Hour Price Chart
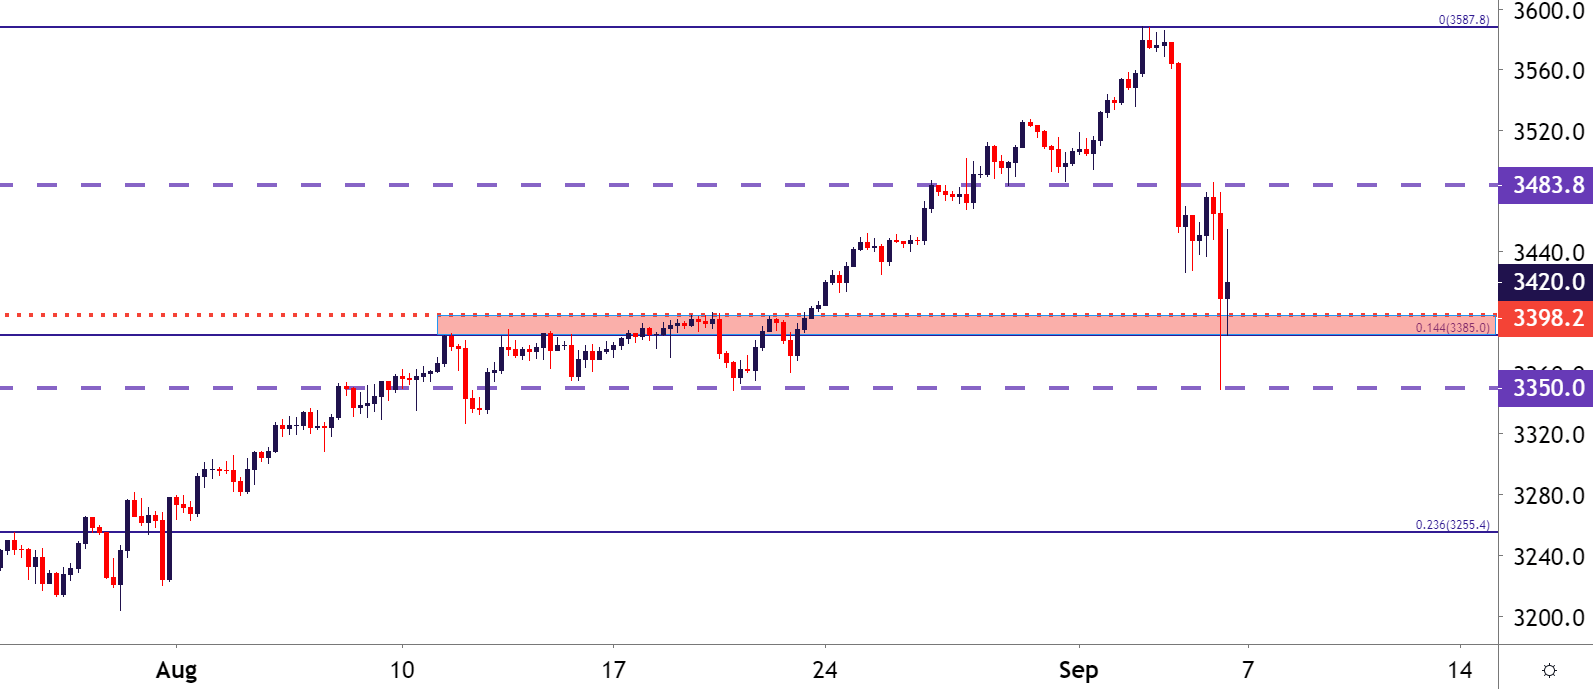
Chart prepared by James Stanley; SPX500 on Tradingview
Nasdaq 100: The High-Flyer Gets Taken Down a Notch
It’s become increasingly difficult to justify current valuations in tech stocks in the US. While the ‘b’ word has been uttered from multiple corners of the inter-webs, the fact of the matter is that we can’t call something a bubble until it’s already burst… until then its mere conjecture (wherein lies the logical problem with ‘spotting bubbles’ in the first place).
But, there’s not much on this Earth that gains 88% in value in less than six months without some type of aberrational quality. The fact that this happened with 100 of the largest tech stocks in the world is mind boggling, and alludes to the fact that there are some other variables at play here.

This week highlights the challenge with the Nasdaq 100: While the S&P 500 retraced as much 6.68% on Thursday-Friday, the Nasdaq 100 gave back more than 10%. Similar to how the gains were amplified on the way up, losses were amplified on the way down, which loads the situation to a degree because if we are at a major inflection point where stock prices begin to turn with aggression, the Nasdaq would likely lead to some considerable pain.
But – for now we just have a couple of days of selling and that doesn’t yet mark a trend. For next week – the level of importance atop price action appears to be around 11,850. This was an area of support-turned resistance and this currently functions as the most recent lower-high. A hold of that high keeps the door open for short operations, focusing on a move back towards the 11,100 area on the chart while a breach re-opens the door for bullish momentum strategies.
Nasdaq 100 Four-Hour Price Chart
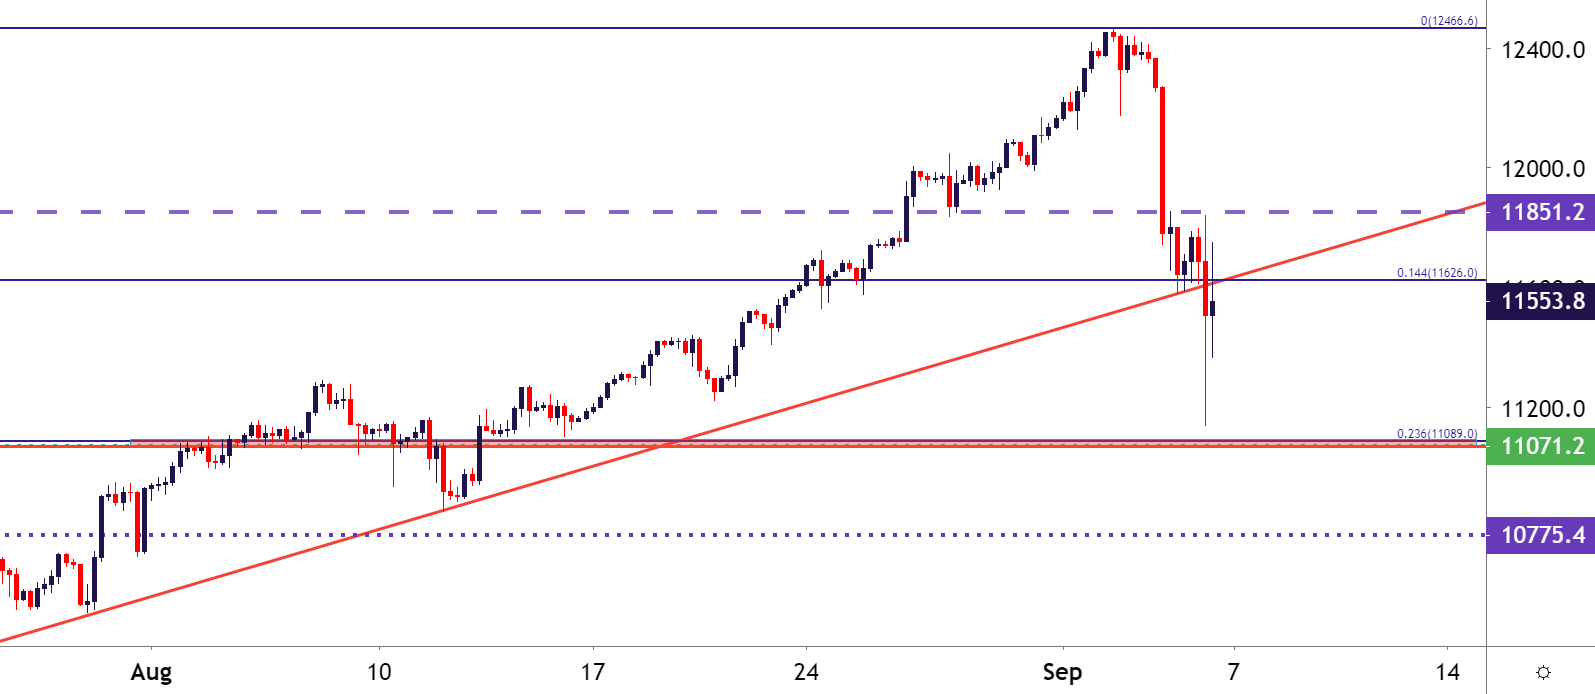
Chart prepared by James Stanley; Nasdaq 100 on Tradingview
Dow Jones: The Laggard May Soon Have Its Time in the Sun
While the Dow Jones hasn’t yet set a fresh all-time-high after the coronavirus came into the equation, that lagging performance was actually somewhat of a benefit this week as the Thursday-Friday pullback saw a little over 5% clawed back. Another benefit is one of chart structure, as there’s a number of nearby areas that can be used for strategy in the index and scenarios like the fresh highs in the S&P 500 and the Nasdaq 100 don’t afford a similar opportunity.
In the Dow, the big area of interest appears to plot from around 27159-27528, which is a confluent zone comprised of two Fibonacci levels. Perhaps more important, this zone has some recent items of interest as this area helped to produce a short-term top (that held for two months) in early-June, followed by a quick spurt of support in late-August.
A move down to this zone with a show of support could open the door for bullish continuation scenarios.
Dow Jones Daily Price Chart
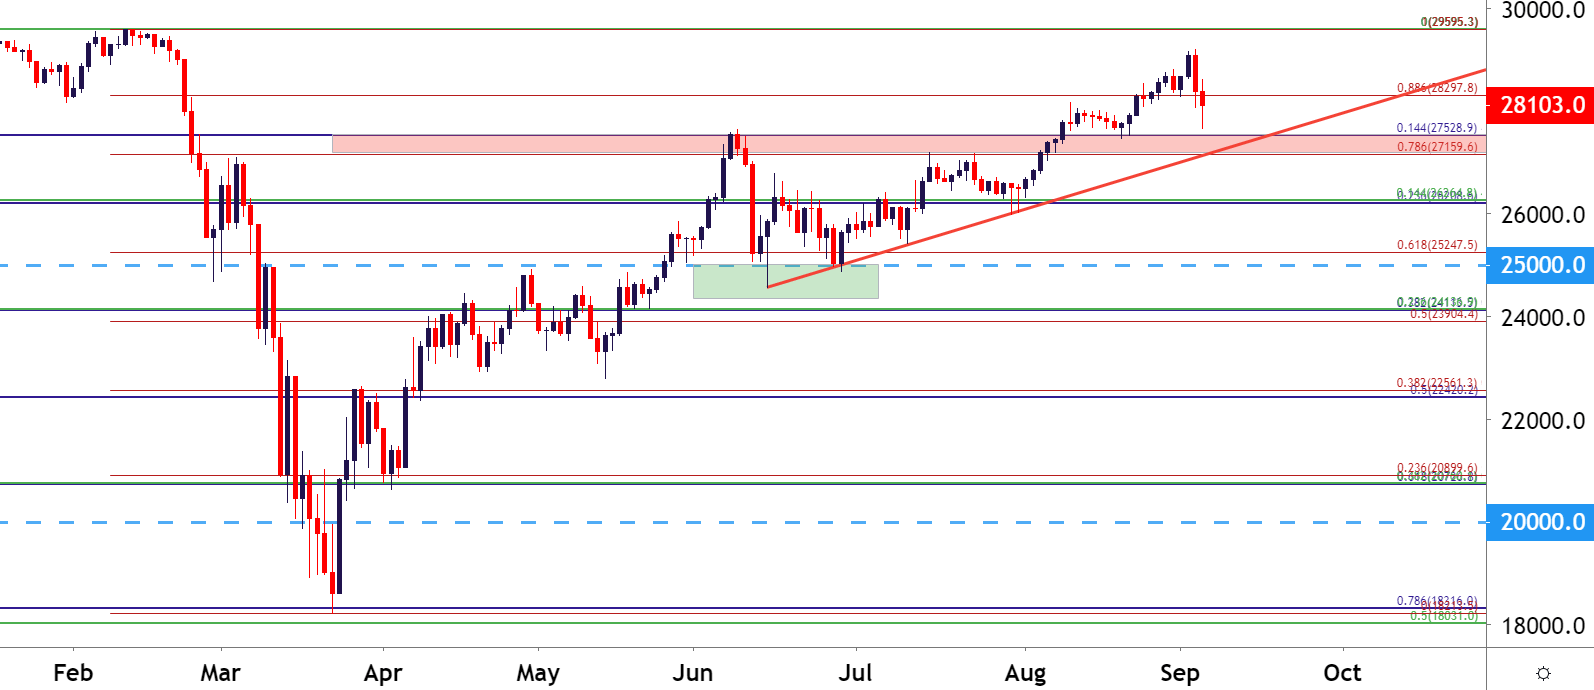
Chart prepared by James Stanley; Nasdaq 100 on Tradingview
--- Written by James Stanley, Strategist for DailyFX.com
Contact and follow James on Twitter: @JStanleyFX


