


US Dollar, DXY, USD Index – Talking Points:
- The US Dollar Index’s (DXY) tentative recovery may prove to be nothing more than a counter-trend correction.
- Break of long-term trend support could be indicative of a cyclical USD downturn.
- Bear Flag continuation pattern on the daily timeframe hints at an extension of the Greenback’s fall from multi-year highs.
The US Dollar’s surge at the beginning of the month may prove to be nothing more than a counter-trend pullback, as cycle analysis suggests the haven-associated currency may drastically underperform its major counterparts over the next 6-9 months.
USD Technical Forecast: Bearish

USD Index (DXY) monthly chart created using TradingView
The chart above highlights the US Dollar’s cyclical nature over the past 34 years, with the currency largely adhering to what appears to be a 16-year rotation. Significant bottoms in the USD Index (DXY) were set in September 1992 (78.19) and March 2008 (70.70).
After bottoming out, the DXY then seems to outperform during the first 8 years of the cycle, with price climbing over 40% on average and posting key highs in July 2001 (121.02) and January 2017 (103.82).
With that in mind, the recent break of long-term trend support extending from the 2011 low (72.70) could be indicative of a cyclical downturn for the Greenback. Given the break of the 8-year uptrend in late 2002 ignited a 34% fall eventually ending 6 years later.
Furthermore, the RSI’s break below 40 and into bearish territory is strikingly similar to the that seen in the fourth quarter of 2002 and hints at further declines for the under-fire USD.
To that end, the haven-associated currency could be poised to drastically extend its recent declines if it fails to climb back above the June 2018 low (93.19), with cycle analysis suggesting USD could fall as much as 30% from current levels before eventually bottoming out in 2024.

USD Index (DXY) Weekly Chart – RSI Flirting with Oversold Territory
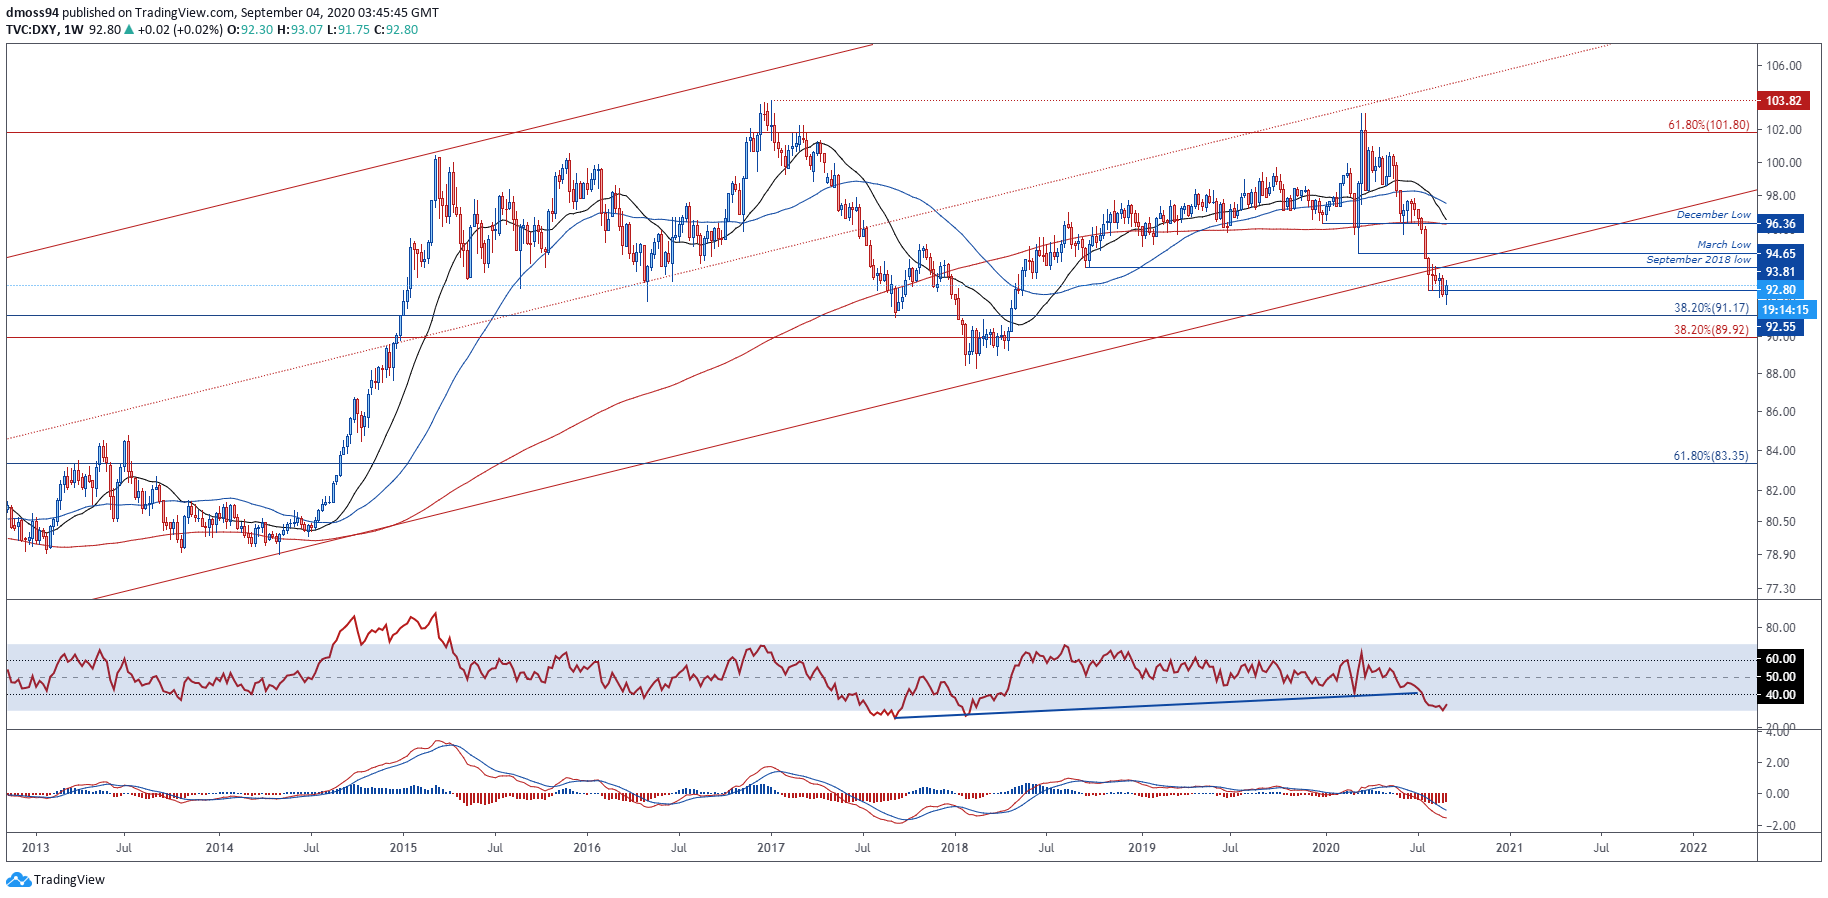
USD Index (DXY) weekly chart created using TradingView
However, jumping into the weekly timeframe highlights the possibility of a more substantial USD rebound, as the RSI notably swerves away from oversold territory and price bounces off key psychological support at the 92 level.
A retest of the 2018 low (93.81) could be in the offing if price closes above the July low (92.55), with a weekly close above 94.00 probably carving a path to retest the December low (96.36).
Having said that, the path of least resistance seems to be lower considering price crashed through the pivotal 2011 uptrend at the end of July and continues to track below the sentiment-defining 200-week moving average (96.30).
In fact, the significant downward steepening of the 21- and 50-WMA’s hint at swelling bearish momentum and could discourage would-be buyers if the DXY is unable to clamber back above the September 2018 low (93.81).
A weekly close below psychological support at the 92 level would probably signal the resumption of the primary downtrend and potentially open the door to test the 2018 low (88.25).
USD Index (DXY) Daily Chart – Bear Flag in Play

USD Index (DXY) daily chart created using TradingView
Zooming into the daily chart reinforces the bearish outlook depicted on the higher timeframes, as the Greenback consolidates in a Bear Flag continuation pattern just above psychological support at the 92 level.
Although the RSI and MACD indicators hint at an extension of the rally from the monthly low (91.75), the 21-day moving average appears to be proving quite a challenge for USD bulls. The 21-DMA has directed price lower for the better part of 4 months.
Nevertheless, a break above the 21-DMA (92.96) and flag midpoint (93.08) could generate a surge to test Descending Channel resistance, with a daily close above the September 2018 low (93.81) needed to invalidate the bearish continuation pattern.
However, with price continuing to track within the confines of two separate bearish patterns, it seems more than likely that further losses are on the cards.
A daily close below flag support at the August 18 swing-low (92.13) may signal the resumption of the primary uptrend and could see the DXY slide towards the 38.2% Fibonacci (91.17), with the implied measured move suggesting price may fall back to support at the 2018 low (88.25).
-- Written by Daniel Moss, Analyst for DailyFX
Follow me on Twitter @DanielGMoss


