


.jpg)

Euro vs US Dollar Technical Outlook
Bullish Momentum Eased, But the Bias Higher Remained
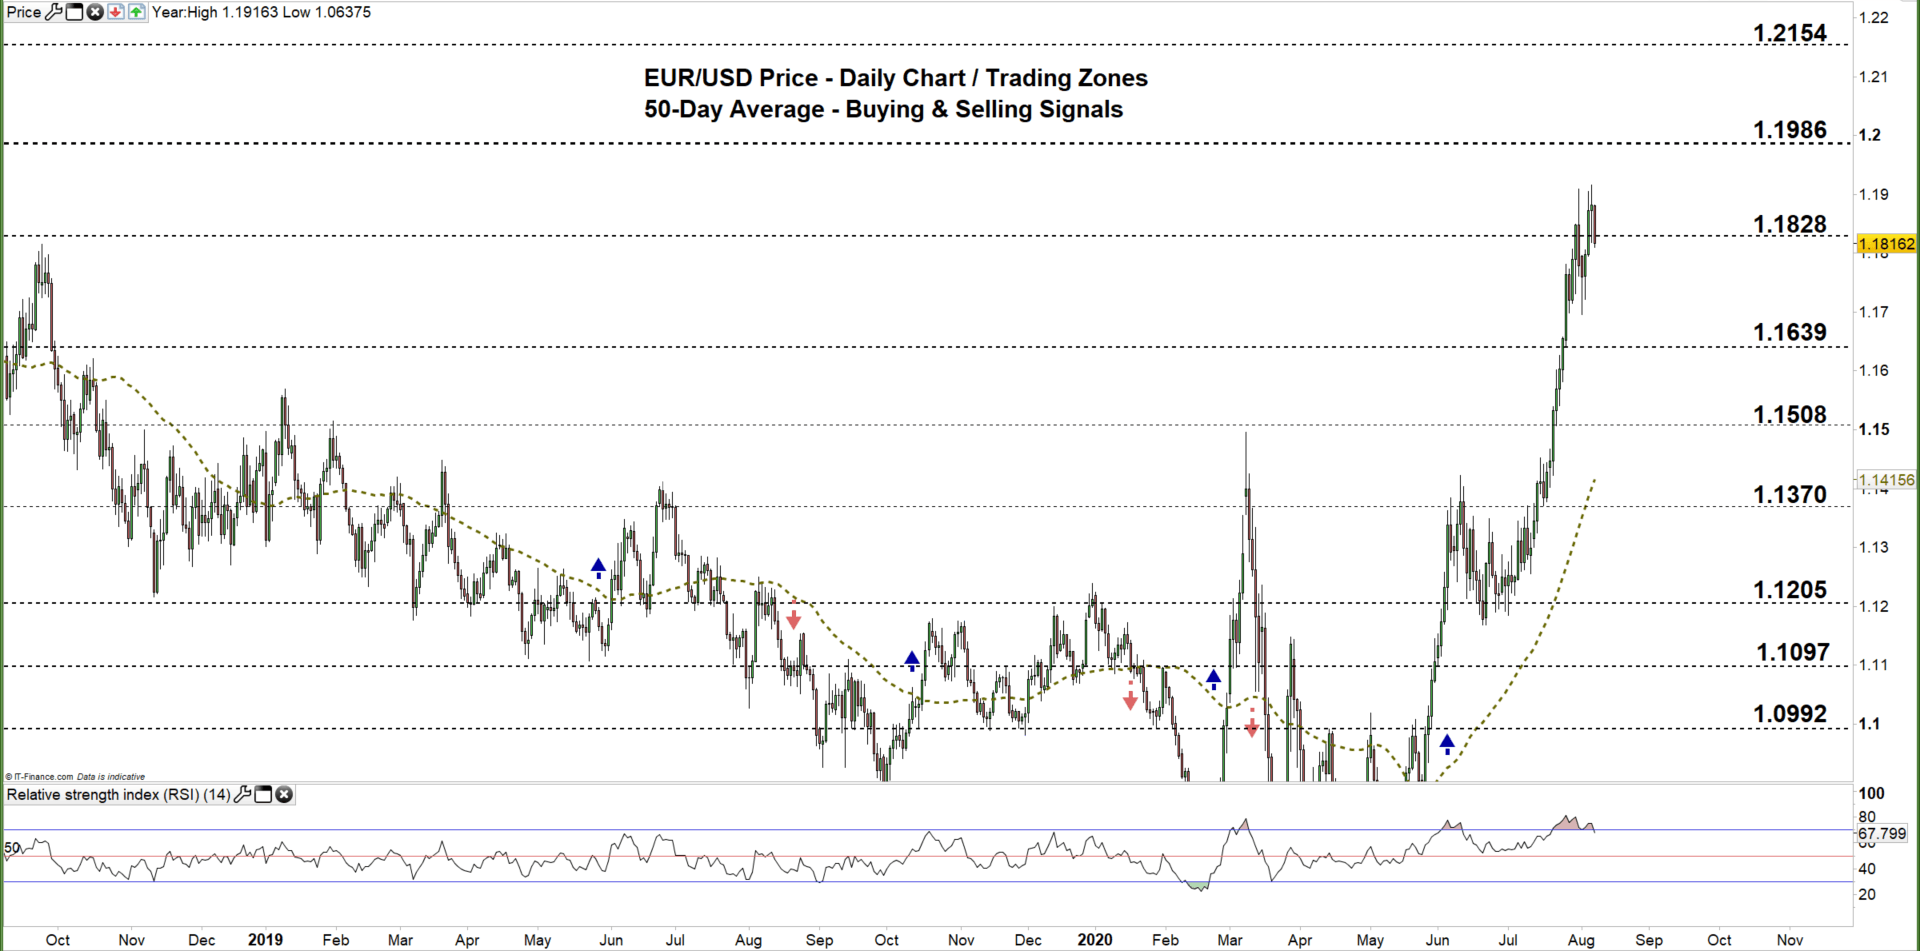
Last week, EUR/USD hit an over two-year high of 1.1909 then retreated after, as some bulls seemed to cut back. Ultimately, a weekly candlestick closed in the green with a 1.0% gain.
Alongside that, the Relative Strength Index (RSI) remained in overbought territory emphasizing the strength of the bullish momentum.
EUR/USD DAILY PRICE CHART (Sep 1, 2018 – AUgust 7, 2020) Zoomed Out

EUR/USD DAILY PRICE CHART (July 10 – August 7, 2020) Zoomed IN
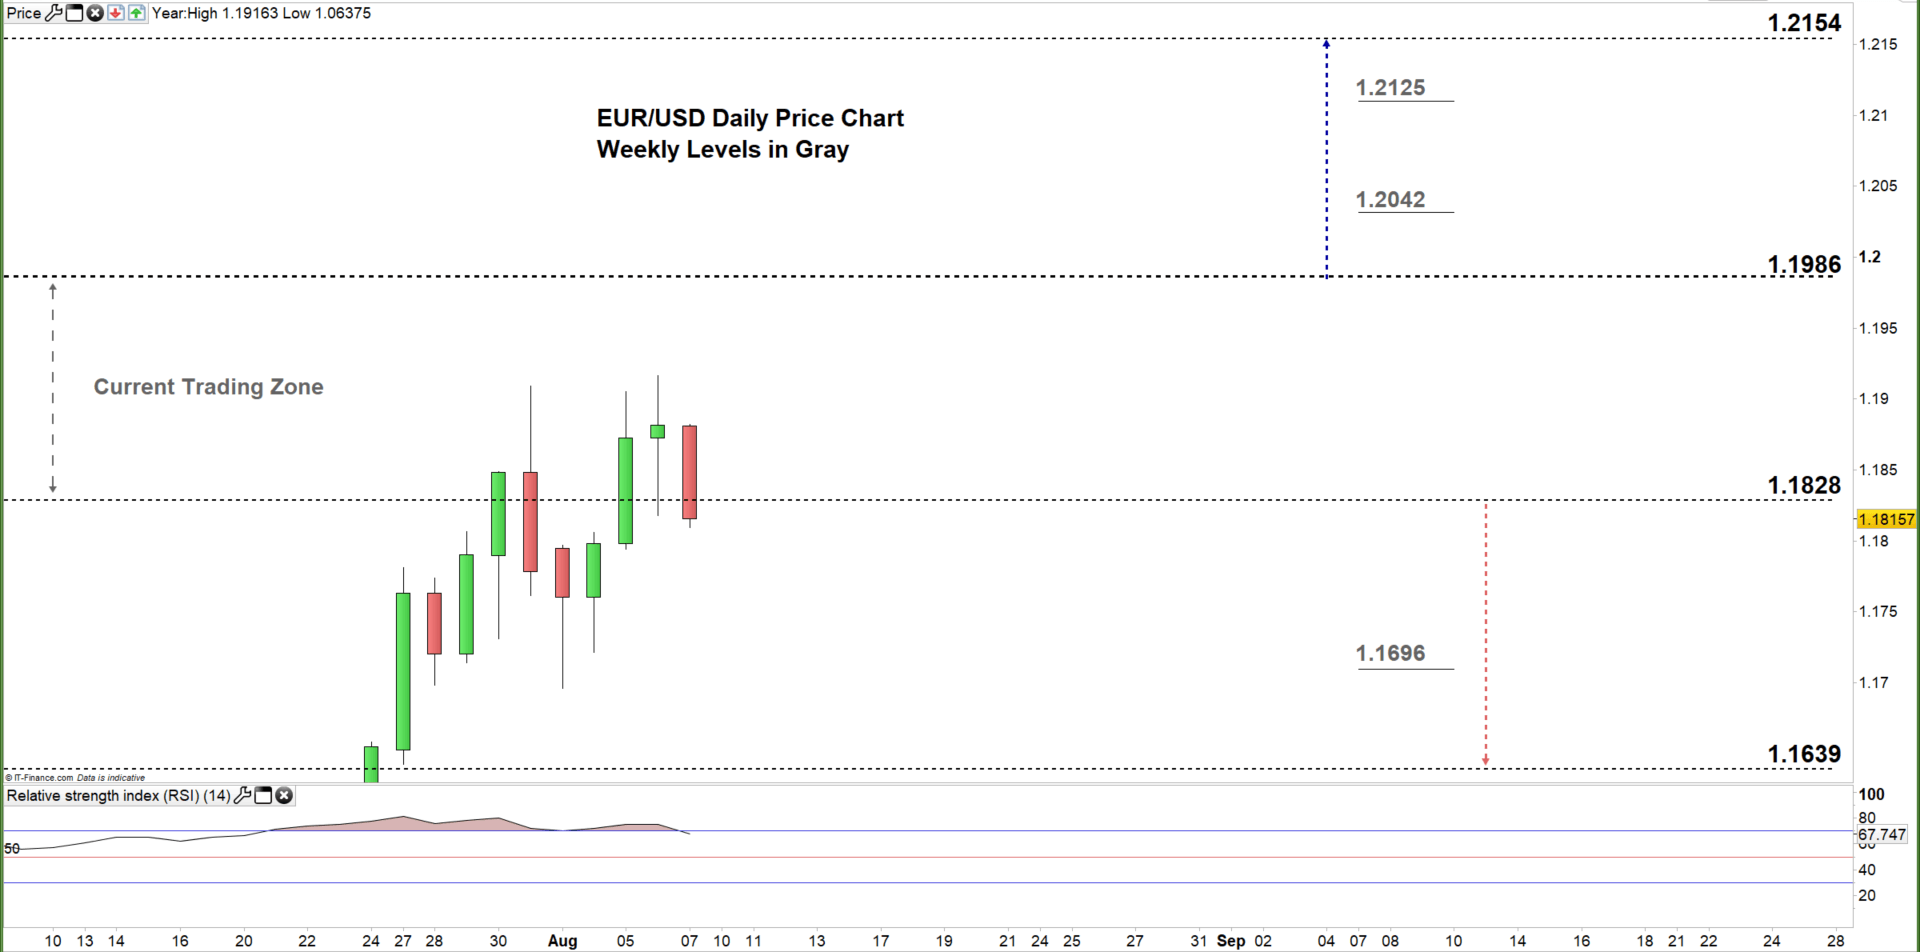
On August 3, EUR/USD U-turned and traded higher highlighting that bullish momentum was still in place. In the same week, the price climbed back to the current 1.1828 – 1.1986 trading zone and printed a new multi-month high at 1.1916.
A daily close above the high end of the current trading zone could encourage bulls to extend the rally towards the monthly resistance level at 1.2154 ( March 2018 low).
On the other hand, a daily close below the low end of the zone reflects bull’s hesitation and may guide EURUSD’s fall towards the weekly support level at 1.1639 ( Aug 2018 high).

EUR/USD Four-Hour PRICE CHART (July 10 – August 7, 2020)

On Thursday, EUR/USD created the second top of a Double Top pattern. A violation of the neckline located at 1.1696 indicates a possible shift in favor bear’s control.
To conclude, while bulls still have the upper hand a break below the bullish trendline support originated from the July 10 low at 1.1254 indicates a weaker upward trend. Therefore, a break below 1.1763 could send the EURUSD towards 1.1698, while a break above the 1.2000 threshold may trigger a rally towards 1.2095. As such, the support and resistance levels marked on the four-hour chart should be kept in focus.
Written By: Mahmoud Alkudsi, Market Analyst
Please feel free to contact me on Twitter: @Malkudsi


