


Australian Dollar Technical Forecast, AUD/USD Exchange Rate – Talking Points:
- The AUD/USD exchange rate poised to extend gains as RSI divergence signals impending cyclical upturn.
- Break of long-term trend resistance may ignite buying pressure.
AUD Technical Forecast: Bullish
The Australian Dollar could be on the verge of a major breakout against the US Dollar, potentially building on its relentless 31% surge from the March low (0.5506) to fresh yearly highs.
AUD/USD Monthly Chart – Divergence Signaling Cyclical Upturn?
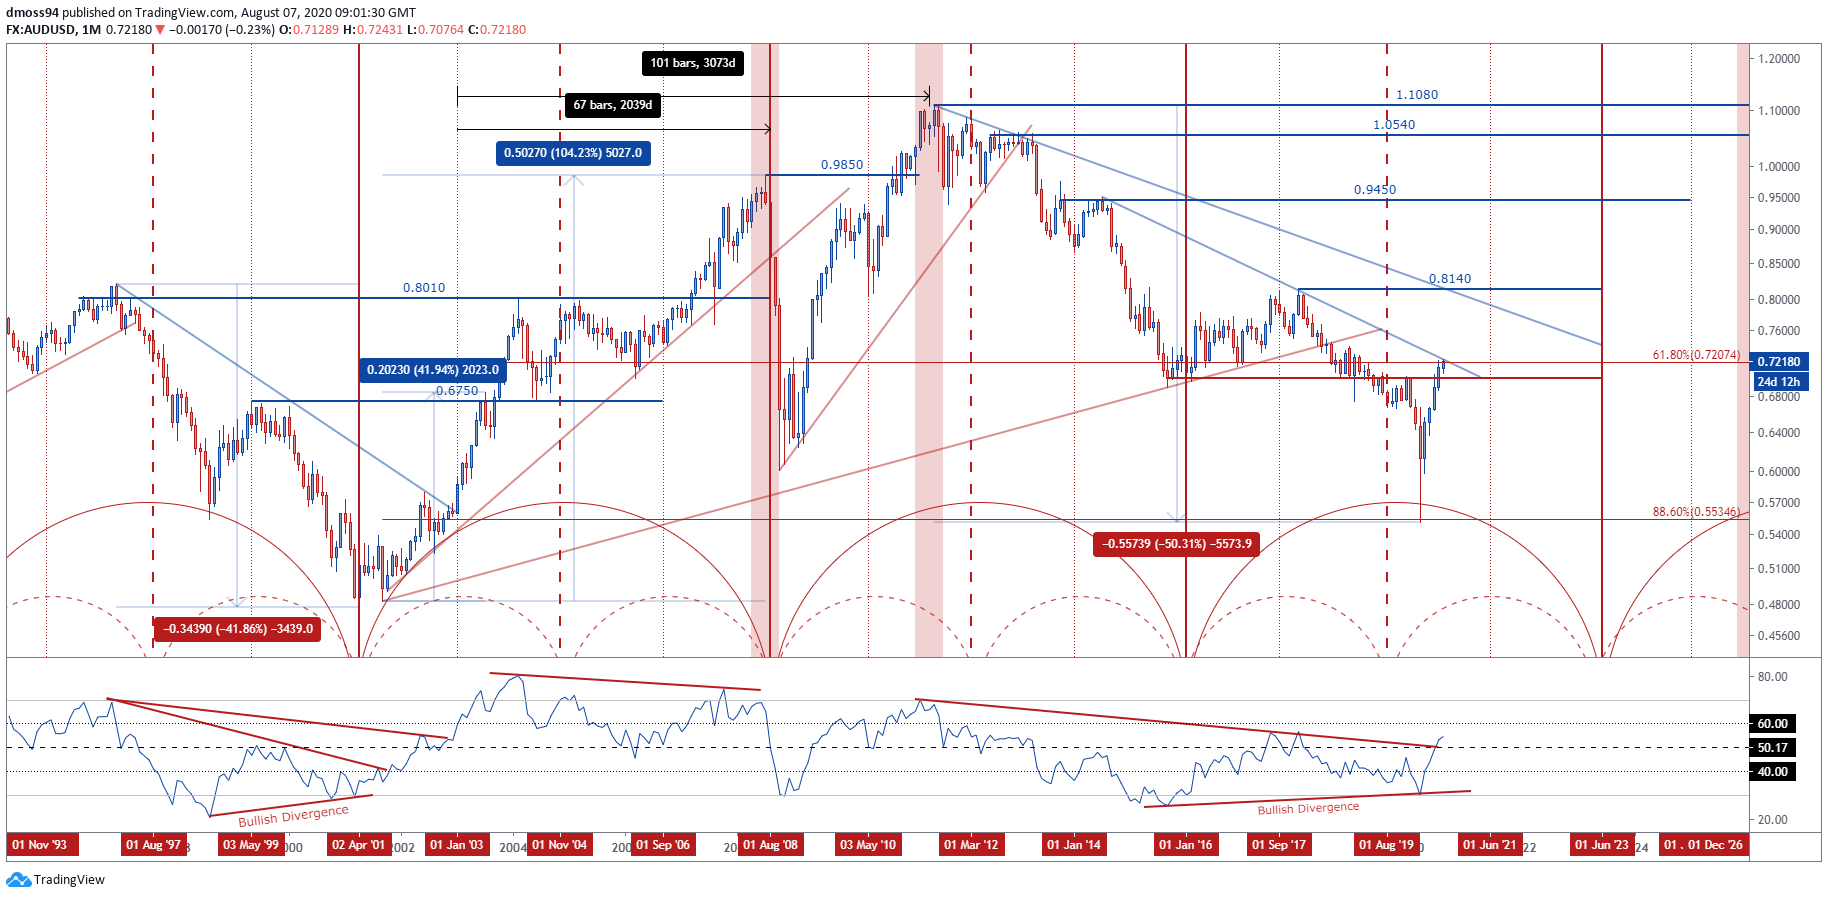
AUD/USD monthly chart created using TradingView
The monthly RSI has accelerated back above its neutral midpoint for the first time since January 2018 after falling devilishly close to oversold territory in March 2020, mirroring the oscillator’s development in early-2003.
In fact, recent AUD/USD price action is strikingly like that seen in 2002, with a break of the 1996 downtrend coinciding with the RSI climbing above 50 and leading to a 104% rally. Finally topping in July 2008 (0.9850), just over 5 years later.
Furthermore, bearish divergence in 2001 and earlier this year seemed to signal the end of a cyclical downturn in price. Both times the RSI failed to follow price to lower lows, AUD/USD rates set major bottoms – September 2001 (0.4823) and March 2020 (0.5506).
With that in mind, a convincing close above key confluence at the 61.8% Fibonacci (0.7207) and 6-year downtrend could ignite a period of sustained AUD strength and signal a significant shift in market sentiment.

AUD/USD Weekly Chart – 2011 Downtrend Capping Rates…For Now
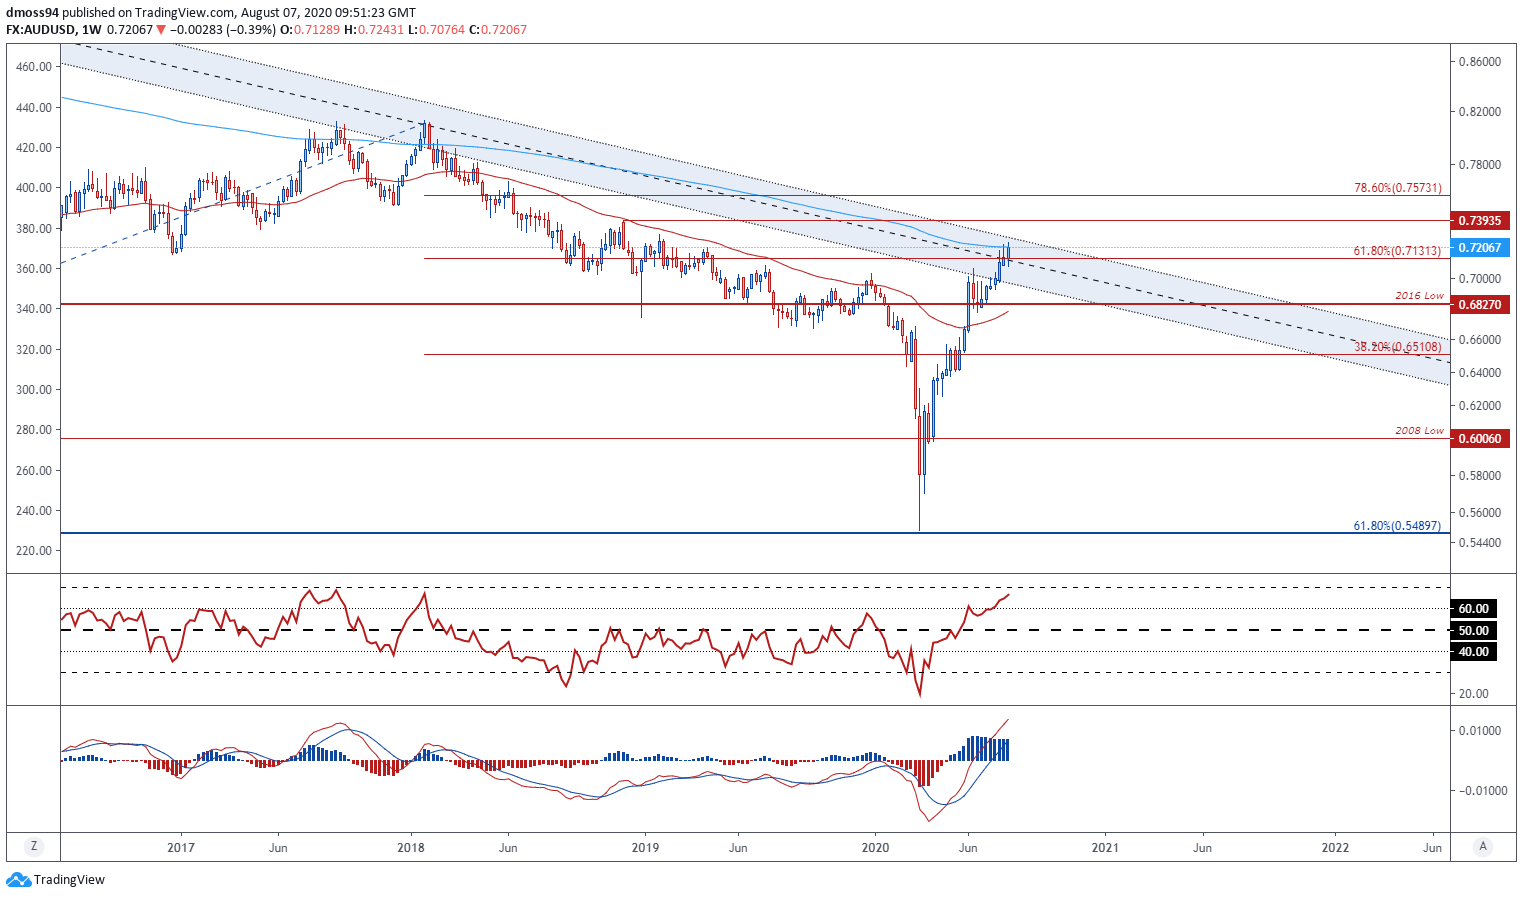
AUD/USD weekly chart created using TradingView
Zooming into a weekly timeframe reinforces the bullish outlook for the Australian Dollar as price bursts through resistance at the 61.8% Fibonacci (0.7131) and tests the sentiment-defining 200-week moving average (0.7213).
The MACD indicator’s explosive surge to the highest levels in over 4 years suggests price may extend its 7-week ascent.
Moreover, the RSI looks set to climb into overbought territory for the first time since the AUD/USD exchange rate was above parity in April 2011 (1.0977).
A weekly close above the 2019 high (0.7295) is needed to validate bullish potential and carve a path for price to test the 78.6% Fibonacci (0.7573).
AUD/USD Daily Chart – Ascending Channel Directing Price Higher
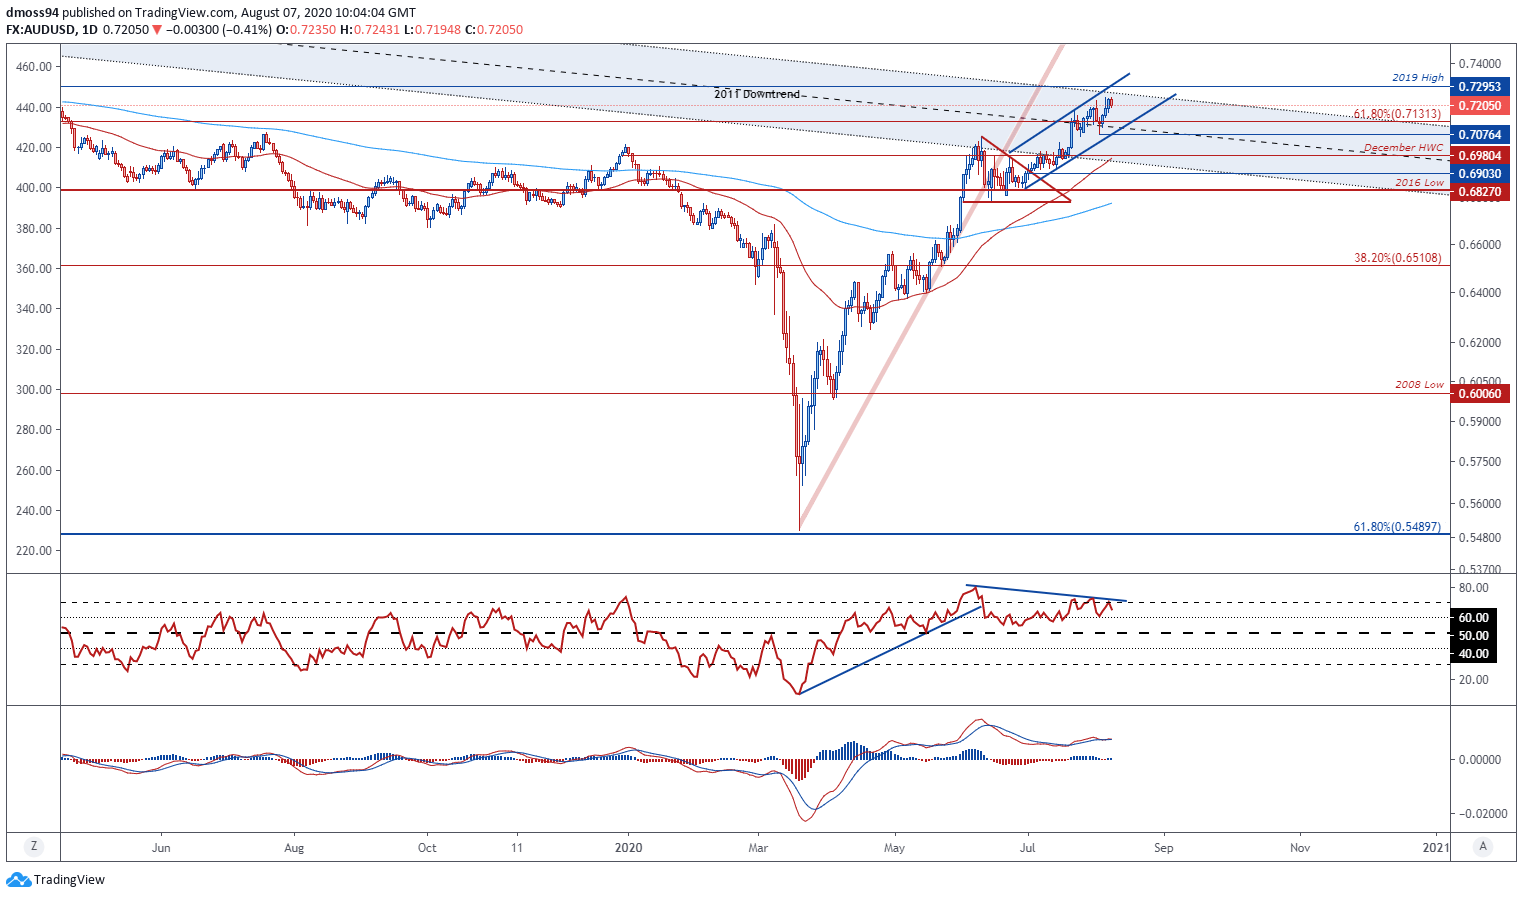
AUD/USD daily chart created using TradingView
Although higher timeframe analysis suggests a bullish outlook for AUD against USD, daily price action hints at underlying exhaustion in the recent uptrend. Given the RSI failed to follow price to higher highs.
However, AUD/USD rates remain constructively perched above the 61.8% Fibonacci (0.7131) and monthly low (0.7076) suggesting a near-term pullback may precede the next impulsive move.
Prices may slide back towards Ascending Channel support in the coming week, alongside the RSI and MACD indicators regressing towards their respective midpoints.
A daily close above the 2019 high (0.7295) is needed to validate a break of the 2011 downtrend and carve a path for price to test the psychologically pivotal 0.74 mark.
Conversely, a break of support at the August low (0.7076) would probably fuel further declines and could see price fall back to the July low (0.6877).
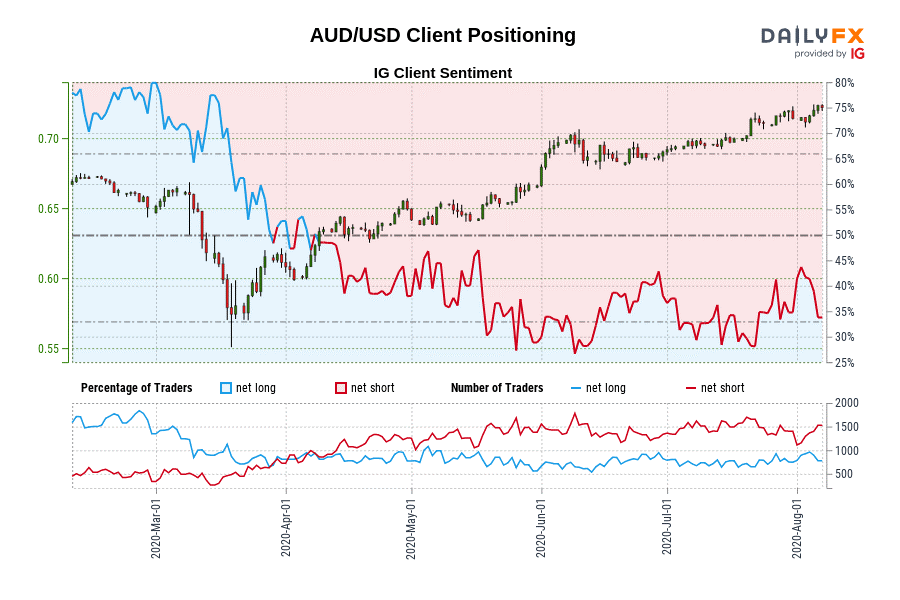
AUD/USD: Retail trader data shows 36.51% of traders are net-long with the ratio of traders short to long at 1.74 to 1. The number of traders net-long is 10.64% lower than yesterday and 7.14% higher from last week, while the number of traders net-short is 2.31% higher than yesterday and 6.49% higher from last week.
We typically take a contrarian view to crowd sentiment, and the fact traders are net-short suggests AUD/USD prices may continue to rise.
Positioning is more net-short than yesterday but less net-short from last week. The combination of current sentiment and recent changes gives us a further mixed AUD/USD trading bias.
-- Written by Daniel Moss, Analyst for DailyFX
Follow me on Twitter @DanielGMoss


