


S&P 500, FTSE 100 Analysis and News
S&P 500 | Divergence Raises Risk of Pullback
Since the rejection of 3300, the S&P 500 remains sluggish, however, the index continues to hold support stemming from 3214. That said, slowing momentum suggests that further upside may be hard to come by in the next week. Alongside this, the bearish RSI divergence signals that the S&P 500 is at risk of a larger pullback. Failure to hold 3214, would leave the 50DMA (3150) exposed, which is critical to maintain the uptrend.
| Change in | Longs | Shorts | OI |
| Daily | 1% | -1% | 0% |
| Weekly | 15% | -13% | -1% |
S&P 500 Price Chart: Daily Time Frame
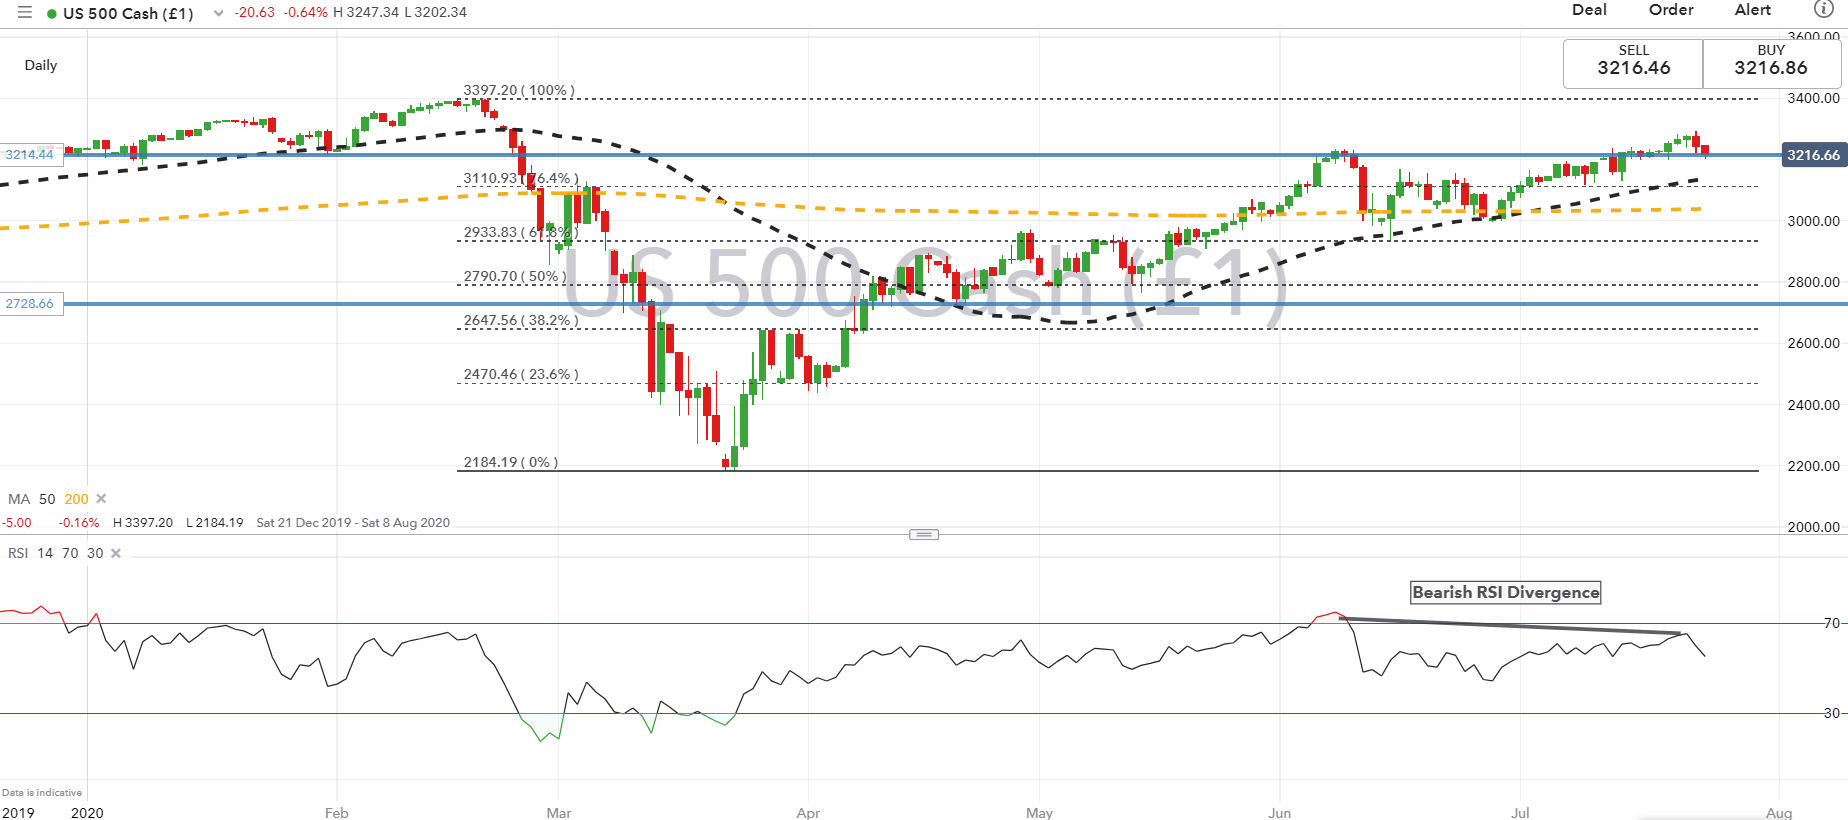
Source: IG
10 Most Popular Candlestick Patterns
FTSE 100 | Challenging Bottom of Range
The FTSE 100 struggles to maintain a foothold the above the 50% Fibonacci retracement and thus continues to remain within a range. That said, failure for 6082 to hold raises the risk of a pullback in the index, which in turn could expose the 6000 on the downside before hitting support at 5890 (38.2% Fibonacci retracement). On the topside, a break above 6400 is needed, to curb the short term bearish outlook on the index.
| Change in | Longs | Shorts | OI |
| Daily | -30% | 25% | 2% |
| Weekly | -44% | 44% | 0% |
FTSE 100 Price Chart: Daily Time Frame
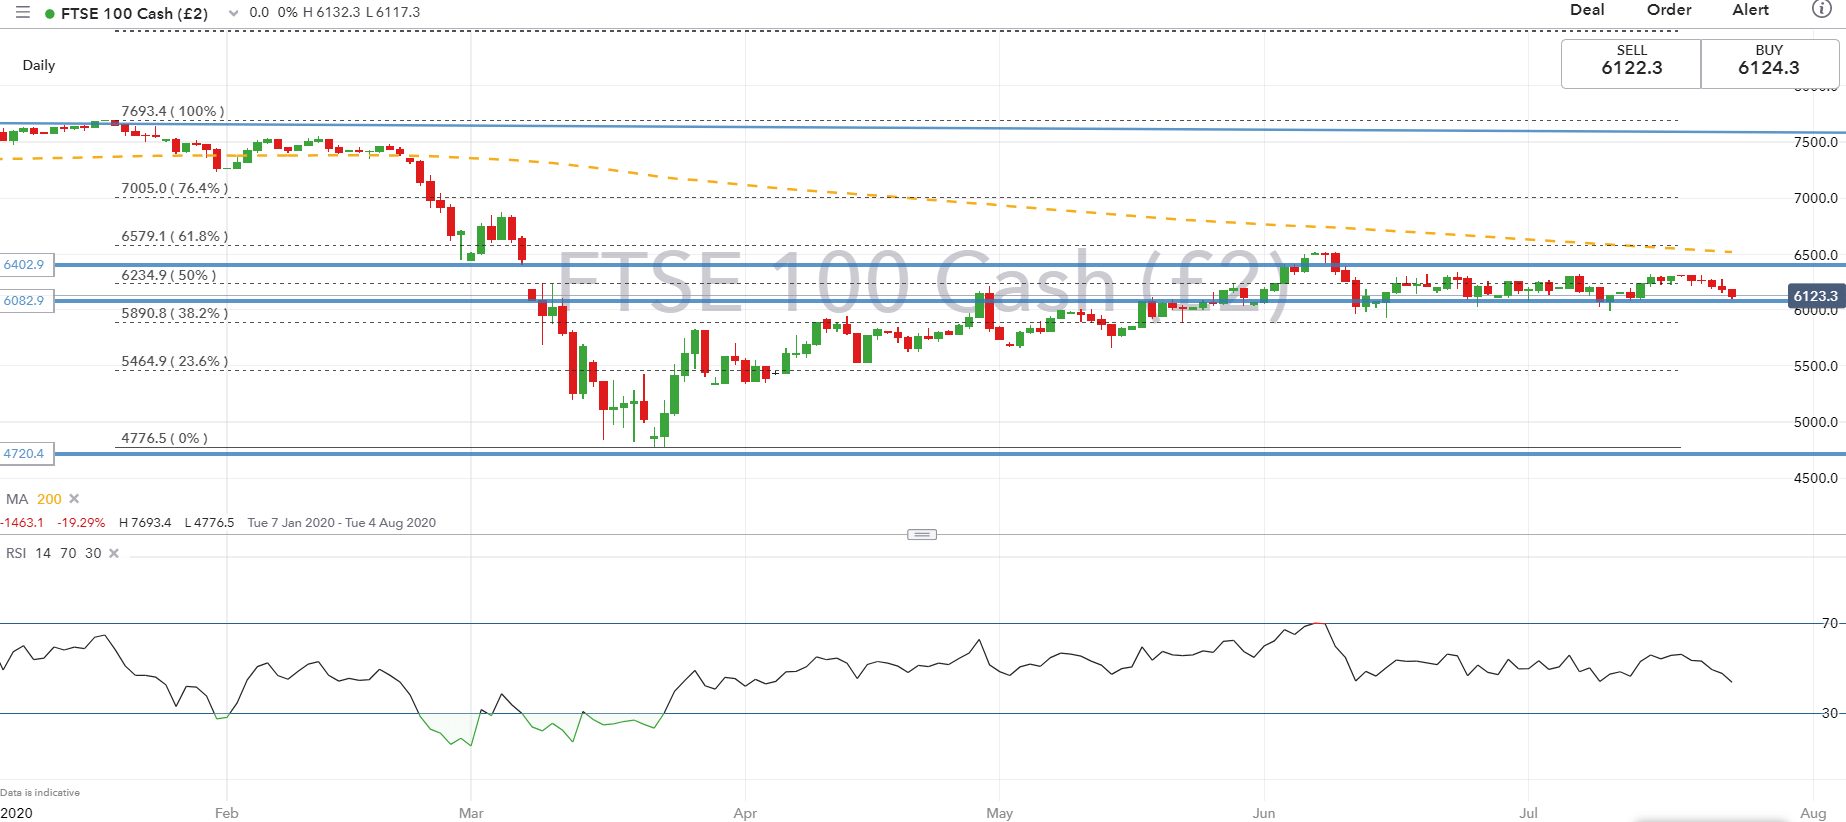
Source: IG
RESOURCES FOR TRADERS
Whether you are a new or experienced trader, we have several resources available to help you; indicator for tracking trader sentiment, quarterly trading forecasts, analytical and educational webinars held daily, trading guides to help you improve trading performance, and one specifically for those who are new to forex.


