


US Dollar Technical Forecast, USD - Talking Points
- US Dollar may bounce at pivotal support after collapsing to three-month lows against its major counterparts.
- Bullish engulfing and divergence on technical indicators suggest an impending reversal. Could this be the trigger for a resurgence of USD strength?
Technical Forecast for USD: Bullish
After 10 consecutive days of selling the US Dollar finally found support just shy of the March low (1.2707), as the Relative Strength Index plunged into oversold territory for the first time since the start of the year.
Retracing the entirety of the ground gained since the early-March surge to 18-year highs (1.4428) has pushed price to a pivotal inflection point at the 2014 uptrend. A Bullish Engulfing candle highlights the degree of buying pressure at this support zone with the RSI rapidly steepening back above 30 hinting at a possible resurgence in USD strength.
Remaining confined within a falling wedge pattern suggests that price action may bounce back to the 200-day moving average (1.3144) with the downtrend extending from the March high (1.4428) and the 1.32-handle possibly capping upside potential.
Nevertheless, bullish divergence visible on technical studies suggests the potential for an extended recovery, as the momentum indicator bounces back from the April extremes and the RSI surges from the lowest levels since late-December 2019.
A daily close back above the February high (1.3244) may confirm a topside break of the 3-month Falling Wedge and could lead to a surge back to the yearly highs althoughthis remains relatively unlikely as both oscillators are yet to snap their respective downtrends from the March high.
Major-Based USD Index Daily Chart
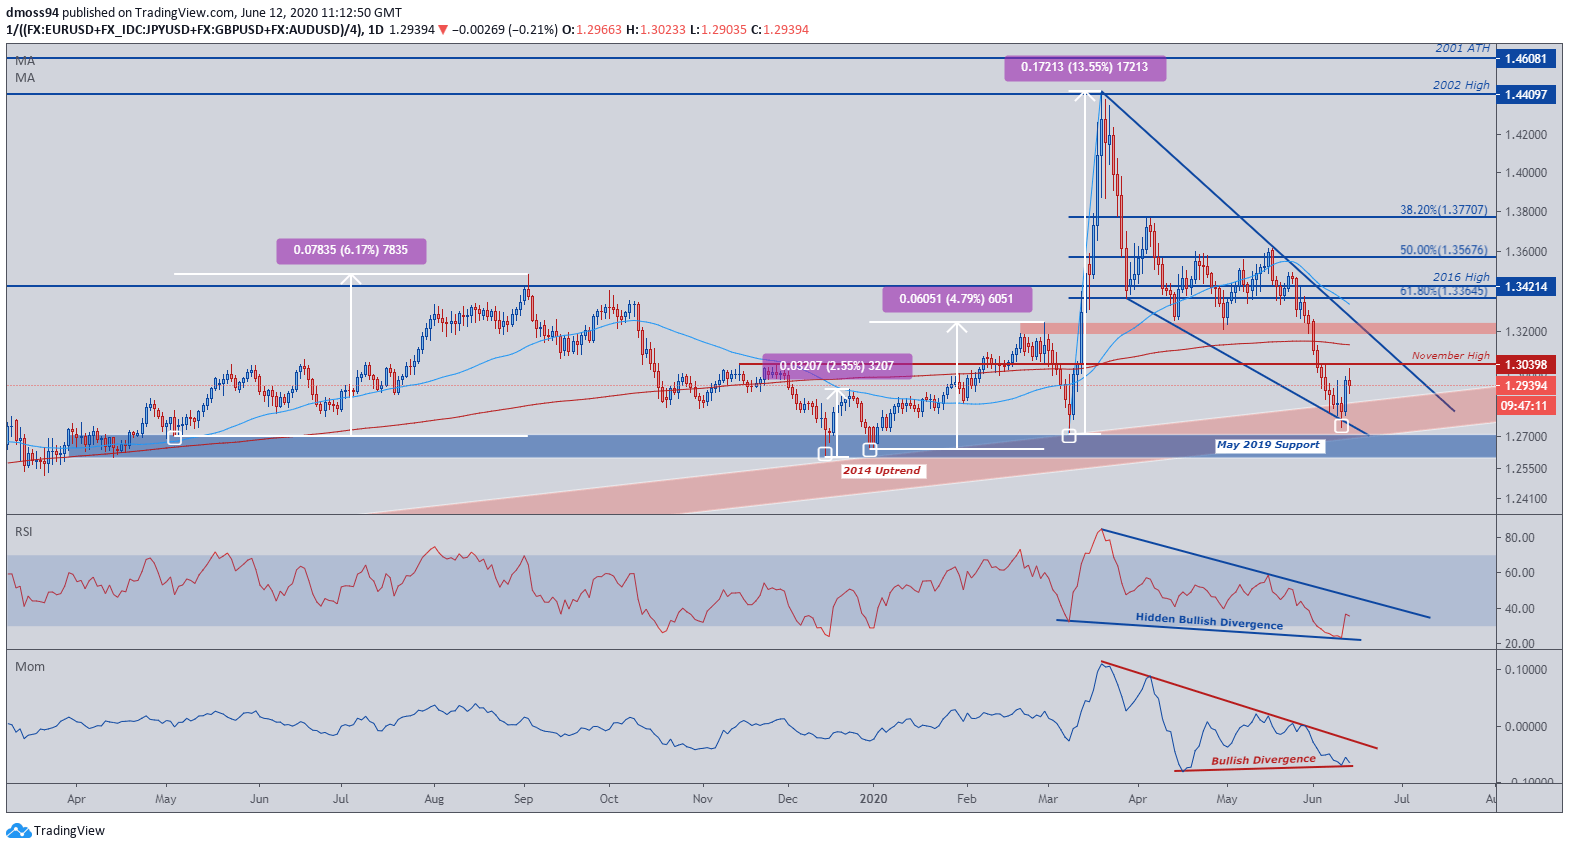
Source – Trading View

Zooming out to a weekly view, the convergence of the 200-MA (1.2670) and 2014 uptrend may provide a springboard for the US Dollar, as the formation of a bullish Spinning Top candle suggests the possibility of an impending reversal.
The reaction of the RSI prior to the bearish reading of 40, and the momentum indicator refusing to dive below 0, reinforces the recent bullish reactions seen on the daily timeframe.
A weekly close above the 50-week moving average may create a path for USD to push back to the May high (1.3616) with a breach possibly resulting in a surge back to the yearly high (1.4428)
Major-Based USD Weekly Index

Source – Trading View
-- Written by Daniel Moss
Follow me on Twitter at @DanielGMoss


