


USD/JPY & AUD/JPY – JAPANESE YEN WEEKLY TECHNICAL FORECAST
- Japanese Yen (JPY) plunges lower as risk appetite swells and safe-haven assets swoon
- USD/JPY rocketed past the 108.00-price level last week thanks to an explosive 179-pip rally
- AUD/JPY made an astronomical move and blew past pre-coronavirus levels to Dec 2019 highs
Japanese Yen bears capitulated last week and helped steer the safe-haven currency nearly 1.7% lower on balance measured by the JXY Index. The sharp decline notched by the Japanese Yen relative to other top FX peers follows the prolonged drift lower in measures of both currency volatility and the S&P 500 VIX Index.

JAPANESE YEN INDEX PRICE CHART: 1-HOUR TIME FRAME (29 MAY TO 05 JUN 2020)
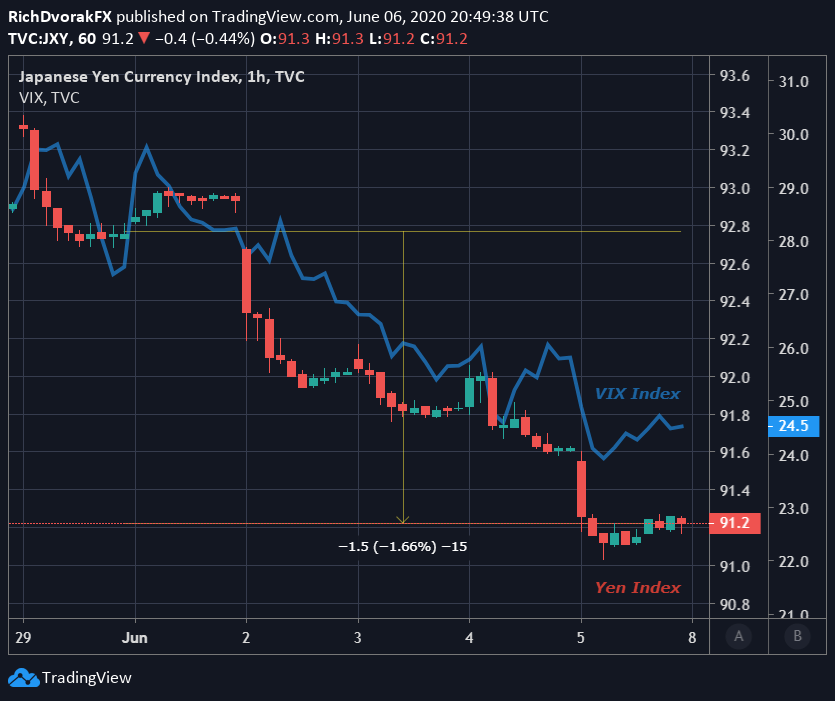
Chart created by @RichDvorakFX with TradingView
Amid widespread market turbulence, which largely follows in the wake of the coronavirus pandemic, including the series of unprecedented responses by central banks and governments, a prolonged stretch of Japanese Yen selling over recent weeks has pressured both USD/JPY and AUD/JPY price action back to even on the year.
The latest breakdown by the Japanese Yen, emphasized by an explosion higher in spot USD/JPY and AUD/JPY, is accompanied by the Nasdaq setting a fresh all-time record as well as the ASX 200 climbing to post-lockdown highs.
| Change in | Longs | Shorts | OI |
| Daily | -2% | 2% | 0% |
| Weekly | 12% | -16% | -6% |
These developments highlight the v-shaped recovery officially achieved by markets, but as several fundamental threats linger, and raise the odds that a day of reckoning looms, where might the Japanese Yen head next as spot USD/JPY and AUD/JPY face daunting levels of technical resistance?
USD/JPY PRICE CHART: DAILY TIME FRAME (DEC 2019 – JUN 2020)
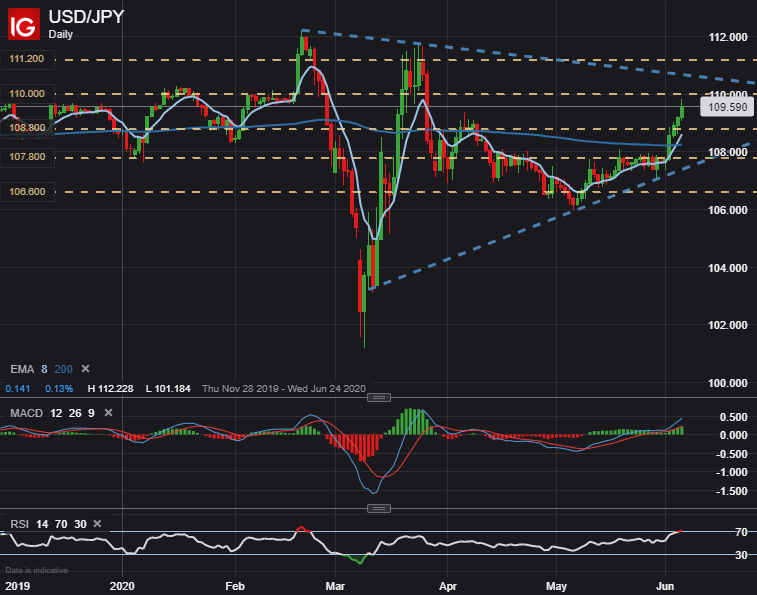
Spot USD/JPY surged past the 107.80-price level and its 200-day exponential moving average, which pushed the Dollar-Yen back into positive territory on the year. Although, as USD/JPY price action approaches the 110.00-handle, a key area of technical confluence, the major currency pair could run into resistance and struggle to continue its climb.

The relative strength index also shows a reading above 70.0 as spot USD/JPY pushes into the ‘overbought’ zone. The MACD suggests upward momentum has accelerated, however, and likely highlights a welcomed technical development by USD/JPY bulls.
AUD/JPY PRICE CHART: WEEKLY TIME FRAME (JUL 2017 – JUN 2020)

AUD/JPY prices jumped a whopping 397-pips last week to trade roughly even year-to-date. Yet, the Aussie-Yen similarly faces an uphill battle as pot AUD/JPY nears its bearish trendline extended through the September 2017, February 2018, and December 2018 swing highs.
| Change in | Longs | Shorts | OI |
| Daily | 0% | 11% | 5% |
| Weekly | 29% | -25% | -3% |
Moreover, a weekly AUD/JPY chart reveals that the pro-risk FX pair is about to probe the upper channel of its Bollinger Band. Statistically speaking, this suggests that spot AUD/JPY has strong potential to mean-revert back lower.
On the other hand, the meteoric rally recorded by AUD/JPY price action, particularly over the last three weeks, has grown in magnitude. Correspondingly, this looks to bolster the average true range, which might facilitate a Bollinger band expansion and help spot AUD/JPY advance further.
-- Written by Rich Dvorak, Analyst for DailyFX.com
Connect with @RichDvorakFX on Twitter for real-time market insight


