


US DOLLAR TECHNICAL OUTLOOK:BULLISH
- AUD/USD is at a critical turning point – will capitulation catalyze a sharp decline?
- EUR/USD has surged for eight days straight but could decline ahead of resistance
- DXY index has fallen to an 11-week low, though selling pressure may start abating
AUD/USD Outlook
AUD/USD has just punctured the lower lip of the 0.7032-0.6911 inflection range (purple-dotted lines), though doubt about lasting follow-through could catalyze a pullback. Capitulation at this key technical zone could also inspire sellers to enter the market and pressure AUD/USD into retesting former resistance-turned-support at 0.6642 (gold-dotted line).
AUD/USD – Daily Chart

AUD/USD chart created using TradingView
EUR/USD Forecast
Since May 26, EUR/USD has risen over four percent, and has closed higher for eight consecutive days as it hovers at multi-week highs. The next obstacle the pair will have to confront may be the early-March swing-high at 1.1447 (upper gold-dotted line) where the pair had previously stalled before plunging almost seven percent. If EUR/USD capitulates before the feet of resistance, it could catalyze a broader pullback.
EUR/USD – Daily Chart
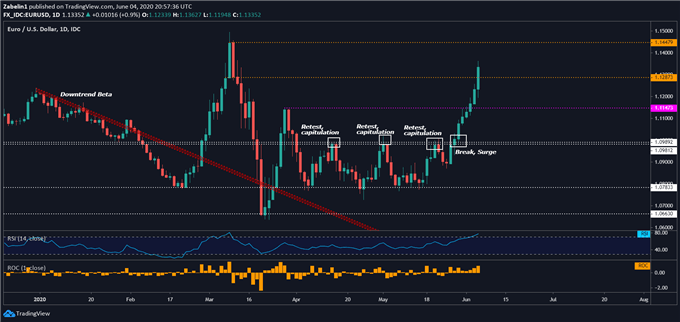
EUR/USD chart created using TradingView
DXY Analysis
The US Dollar index (DXY) has closed lower for eight consecutive days after trading sideways throughout April. The Greenback is now hovering just above a narrow but critical support range between 96.60 and 96.52. Cracking that floor opens the door to retesting the mid-March swing-low at 95.04. However, if selling pressure abates, DXY may seek to retest former support-turned-resistance at 98.27.
DXY – Daily Chart

DXY chart created using TradingView
--- Written by Dimitri Zabelin, Currency Analyst for DailyFX.com
To contact Dimitri, use the comments section below or @ZabelinDimitri on Twitter


