


S&P 500, FTSE 100 Analysis and News
- S&P 500 | Is the Best Behind Us?
- Nasdaq 100 | Fresh Record High, Beware of Bearish Divergence
- FTSE 100 | Recovery Extends
S&P 500 | Is the Best Behind Us?
The S&P 500 has broken above key resistance in the form of the 76.4% Fibonacci retracement of the Q1 crash, which in turn has opened the door to further gains. Eyes will be on the weekly close, whereby a hold above 3200 may keep topside resistance at 3260 within its site. While bullish momentum this week has shown little signs of easing, 3260 could pave the way for slight consolidation. Alongside this, given the size of the rally in equities, current levels suggest that the best may be behind us, much like the Nasdaq 100, which hit a fresh record high. On the downside, support in the S&P 500 is situated in the low 3100s.
| Change in | Longs | Shorts | OI |
| Daily | 1% | -1% | 0% |
| Weekly | 15% | -13% | -1% |
S&P 500 Price Chart: Daily Time Frame
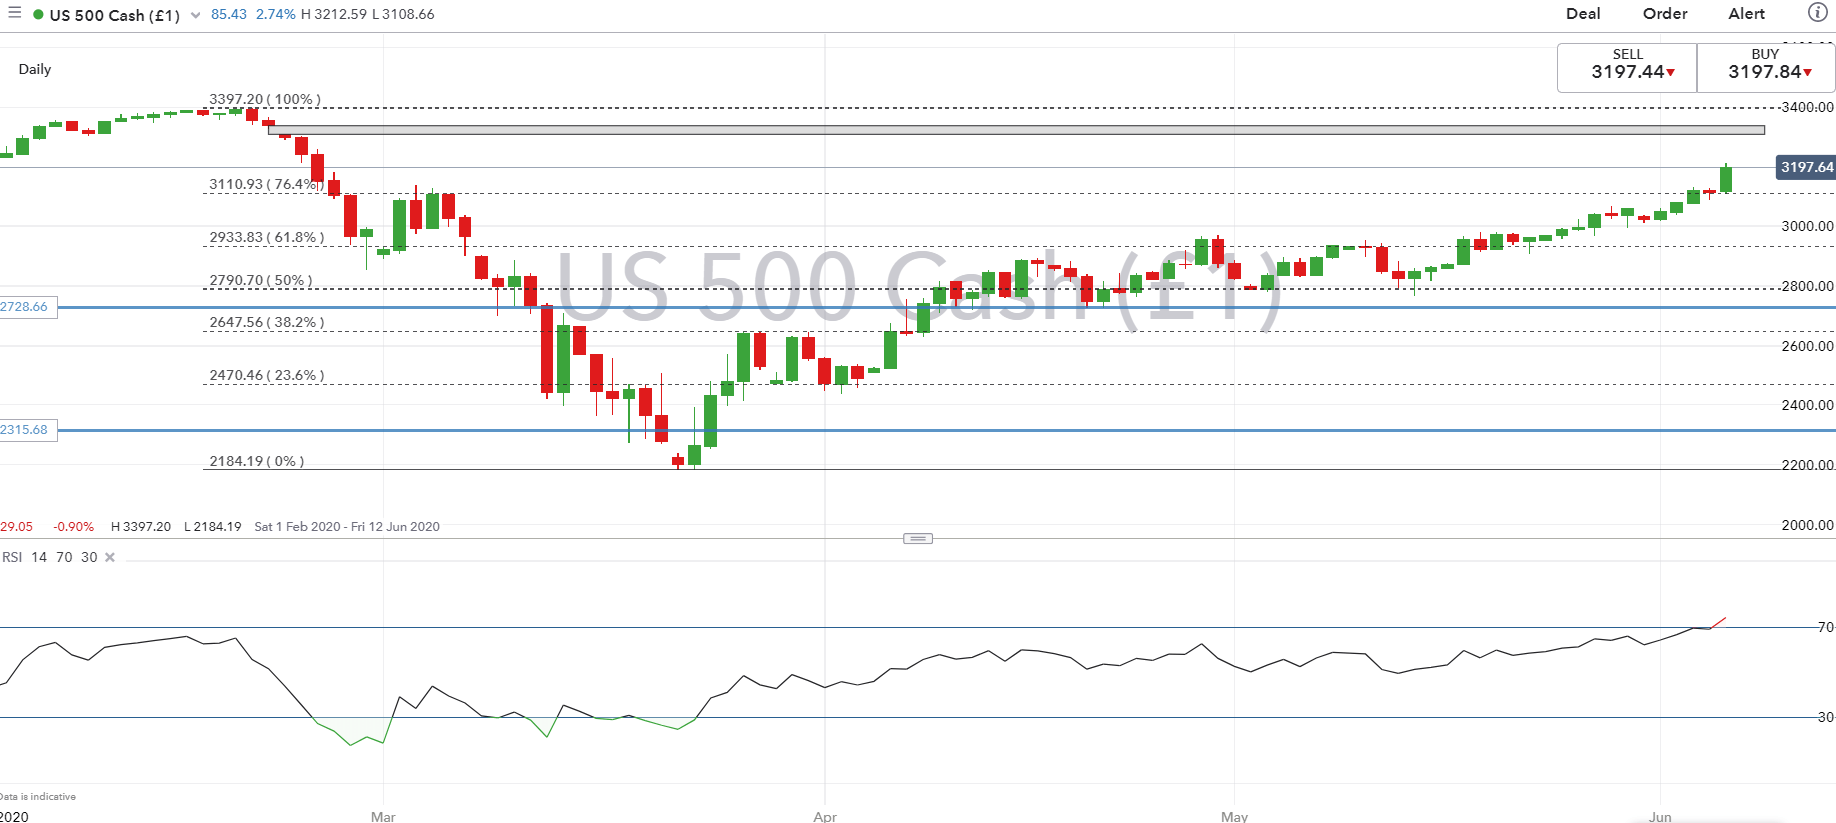
Source: IG Charts
Nasdaq 100 | Fresh Record High, Beware of Bearish Divergence

FTSE 100 | Recovery Extends
Despite lagging its major counterparts, the FTSE 100 has gone from strength to strength after breaking above the 50% retracement of the Q1 sell-off, while also closing the early March gap. That said, the FTSE 100 looks to potentially extend its recovery toward the first hurdle at the 61.8% fib at 6579 before the 200DMA (6747).
| Change in | Longs | Shorts | OI |
| Daily | -30% | 25% | 2% |
| Weekly | -44% | 44% | 0% |
FTSE 100 Price Chart: Daily Time Frame

Source: IG Charts
RESOURCES FOR TRADERS
Whether you are a new or experienced trader, we have several resources available to help you; indicator for tracking trader sentiment, quarterly trading forecasts, analytical and educational webinars held daily, trading guides to help you improve trading performance, and one specifically for those who are new to forex.
--- Written by Justin McQueen, Market Analyst
Follow Justin on Twitter @JMcQueenFX


