Gold Talking Points
Gold attempts to retrace the decline from the end of March, and the price for bullion may exhibit a bullish behavior over the coming days as it initiates a fresh series of higher highs and lows.
Technical Forecast for Gold: Bullish
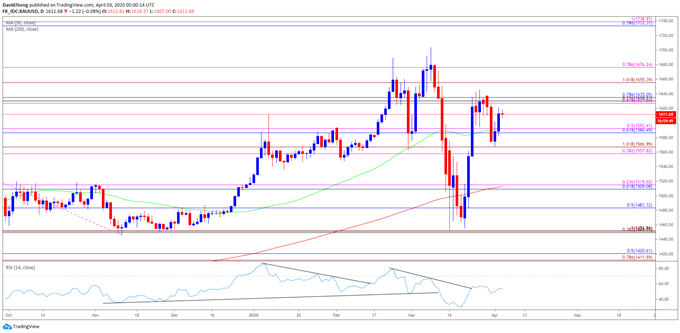
The recent pullback in gold was short live as the precious metal bounced back from a weekly low of $1568, and the price for bullion may work its way towards the yearly high ($1704) as the COVID-19 pandemic spurs a flight to safety.
Keep in mind, prior to the coronavirus, the reaction to the former-resistance zone around $1447 (38.2% expansion) to $1457 (100% expansion) helped to rule out the threat of a Head-and-Shoulders formation, with a similar scenario taking shape in March after the price of gold took out January low ($1517).
The former resistance zone may continue to act as support as the weakening outlook for growth saps investor confidence, and the rebound from the March low ($1451) may continue to unfold in April as the price of gold initiates a fresh series of higher highs and lows.
Gold Price Daily Chart

Source: Trading View
The opening range for 2020 instilled a constructive outlook for the price of gold as the precious metal cleared the 2019 high ($1557), with the Relative Strength Index (RSI) pushing into overbought territory during the same period.
A similar scenario materialized in February, with the price of gold marking the monthly low ($1548) during the first full week, while the RSI broke out of the bearish formation from earlier this year to push back into overbought territory.
However, the price of gold has failed to maintain the monthly opening range for March after trading to a fresh yearly high ($1704), with the recent decline producing a break of the January low ($1517).
Nevertheless, the reaction to the former-resistance zone around $1450 (38.2% retracement) to $1452 (100% expansion) casts a constructive outlook for bullion especially as the RSI reverses course ahead of oversold territory and breaks out of the bearish formation carried over from the previous month.
Need a close above the Fibonacci overlap around $1627 (61.8% expansion) to $1635 (78.6% retracement) to bring the $1655 (161.8% expansion) region on the radar, with the next area of interest coming in around $1676 (78.6% expansion) followed by the yearly high ($1704).
--- Written by David Song, Currency Strategist
Follow me on Twitter at @DavidJSong


