FTSE 100, DAX 30 Analysis and News
FTSE 100 | Key Support Tested
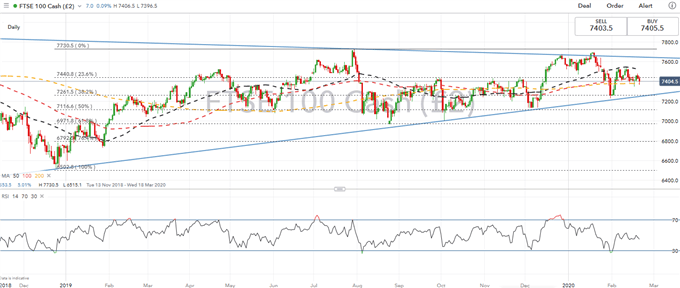
The FTSE 100 has been lacking a directional bias, given that the index has continued to find support at the 200DMA (7377), while the 50DMA (7520) has curbed upside in the short run. Alongside this, trendline resistance above 7600 remains firm and is unlikely to be challenged in the near-term. That said, with the RSI continuing to trend lower, eyes are for a firm break below 200DMA, which in turn could see a move towards the 38.2% Fibonacci retracement at 7261.
| Support | Resistance | ||
|---|---|---|---|
| 7377 | 200DMA | 7440 | 23.6% Fib |
| 7350 | Feb 18th low | 7480 | Feb 20th High |
| 7261 | 38.2% Fib | 7520 | 50DMA |


FTSE 100 Price Chart: Daily Time Frame

Chart by IG
DAX 30 | Reversal Off Channel Top
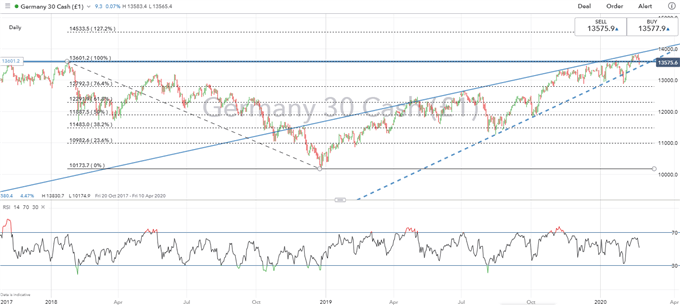
Having consolidated around the record highs of 13800, the DAX has since reversed from its channel top to break below prior support (now resistance) at 13600. While the impact of the coronavirus has been somewhat lacking, investors remain cautious nonetheless, which in turn leaves the index vulnerable to a notable pullback, particularly on a break below the channel bottom.
| Change in | Longs | Shorts | OI |
| Daily | -4% | -4% | -4% |
| Weekly | 26% | -14% | -4% |
| Support | Resistance | ||
|---|---|---|---|
| 13450 | Channel Bottom | 13600 | - |
| 13400 | 50DMA | 13895 | Channel Top |
| 12792 | 76.4% Fib | 14000 | - |
DAX 30 Price Chart: Daily Time Frame

Chart by IG
RESOURCES FOR FOREX & CFD TRADERS
Whether you are a new or experienced trader, we have several resources available to help you; indicator for tracking trader sentiment, quarterly trading forecasts, analytical and educational webinars held daily, trading guides to help you improve trading performance, and one specifically for those who are new to forex.
--- Written by Justin McQueen, Market Analyst
Follow Justin on Twitter @JMcQueenFX


