


USD/CHF Talking Points:
- Both the US Dollar and USD/CHF are coming off of major monthly highs.
- USD/CHF and USD had stretched into overbought territory according to the relative strength index (RSI) on the daily chart.
US Dollar Comes Off of Fresh Multi-Year High
For much of last year, USD/CHF remained in a range. But, as the door opened into December, sellers began to make way and price action started on a series of lower-lows and lower-highs that continued through the 2020 open. After finding resistance at the price of parity in early-December, sellers took over and drove into the 2019 close; after a bit of extension in the first two weeks of 2020 trade, a quick pullback found lower-high resistance at the .9750 psychological level.
| Change in | Longs | Shorts | OI |
| Daily | -1% | 1% | 0% |
| Weekly | 1% | -2% | 1% |
That resistance zone held multiple topside tests through the February open until, eventually, buyers were able to break-free to a fresh monthly high. That theme largely continued in USD/CHF price action as it tested the .9850 level on the chart. As the pair is now over 70 pips off of monthly highs, the .9750 psychological level is back in sight.
USD/CHF Daily Price Chart
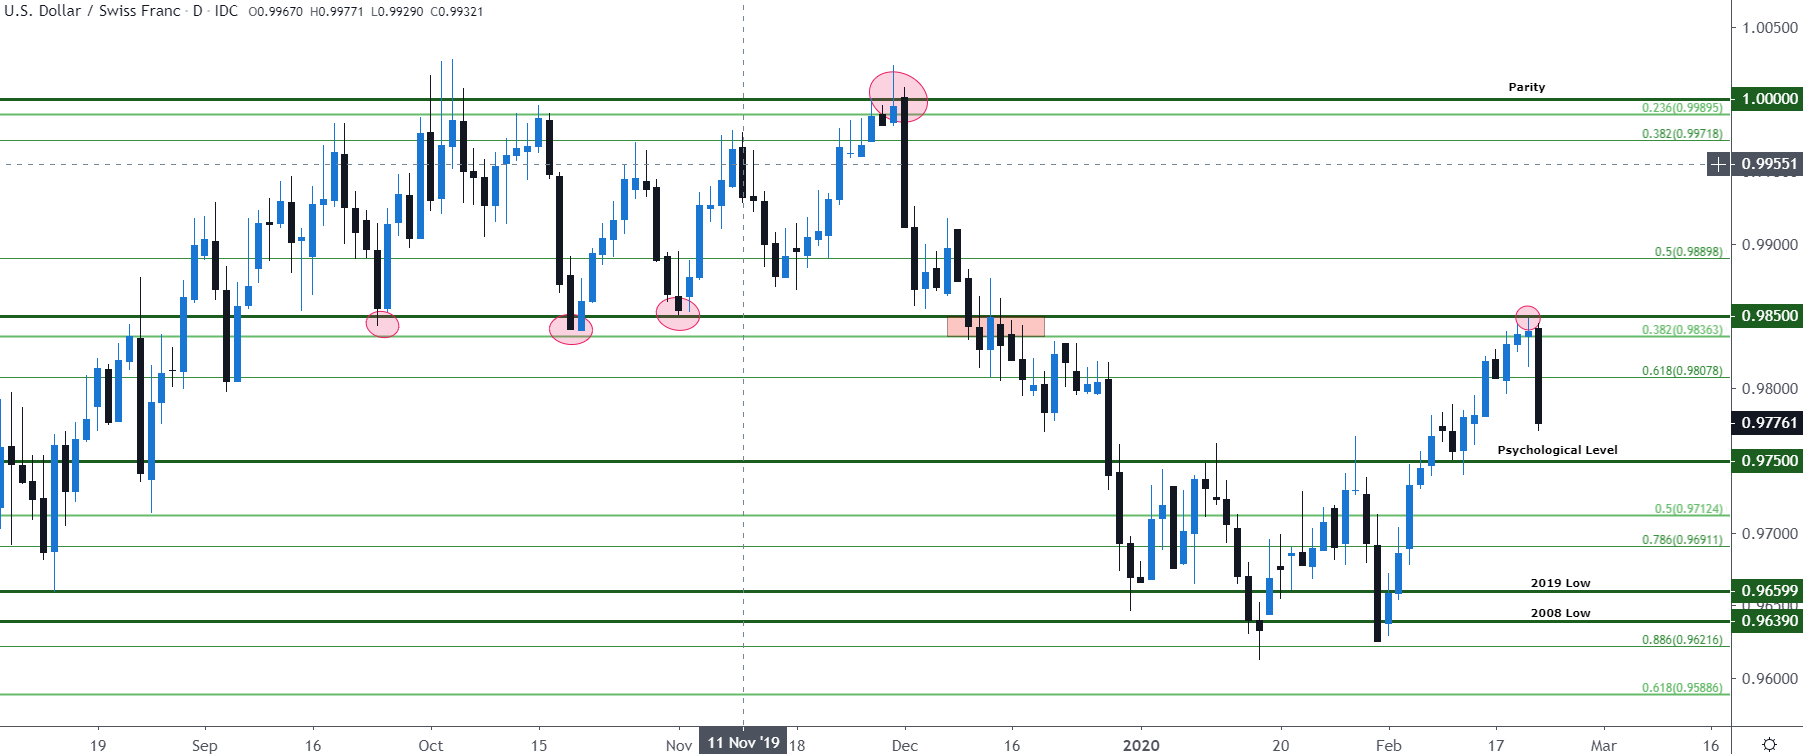
Chart Prepared by Austin Sealey; USD/CHF on TradingView
Taking a closer look at the four-hour chart, there is confluent resistance area just above recent price action. The .9850 level came into play as key support on major down moves in Q3 2019 as seen above, and currently marks the top of the February bullish run in USD/CHF. Also at this price level is a major 0.382 Fibonacci level and trendline resistance that ran into recent topside wicks prior to the selloff.
USD/CHF Four-Hour Price Chart
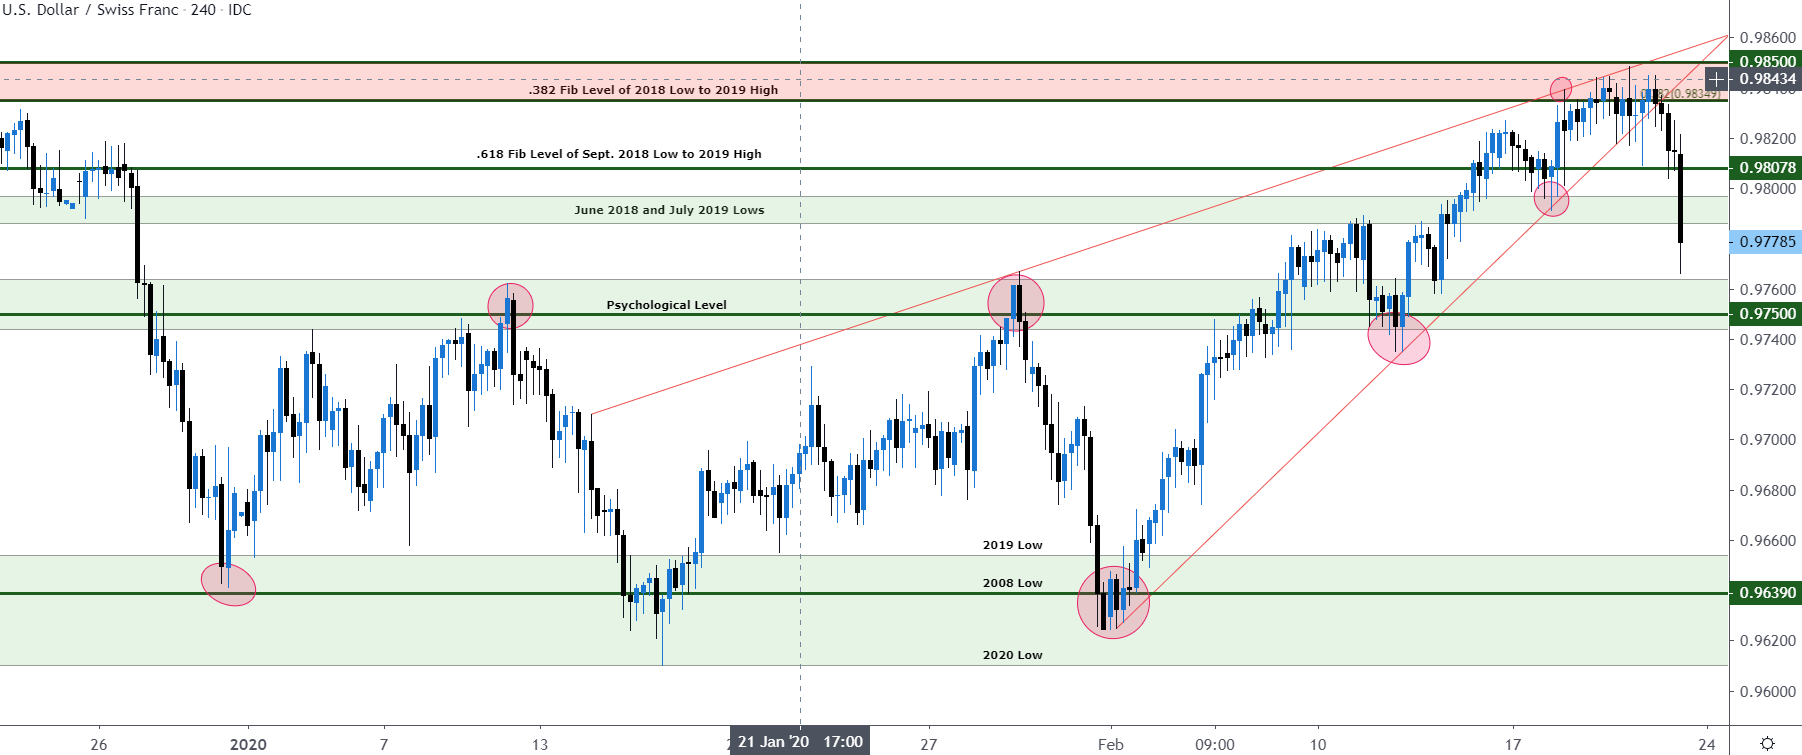
Chart Prepared by Austin Sealey; USD/CHF on TradingView
Generally speaking, the Swiss Franc has put in a strong start to 2020. In the same time period, from January 1st to January 31st, the US Dollar Index rose over 1.0%, USD/CHF fell roughly 0.45%. This is a major contradiction that highlights how the Swiss Franc was generally stronger than the US Dollar in that observed time period. Also, important to note is that USD/CHF is up about 2.0% off of January 1st lows while currencies like the Euro, Kiwi and Yen have all fallen by at least 3.5% against the Dollar.

With a US Dollar that had stretched into overbought territory and a USD/CHF pair that found resistance, there was an interesting setup for US Dollar weakness. However, the question is now what’s next? As the pair eyes the .9750 psychological level once again, the big question is whether sellers can continue to drive lower-lows and lower-highs or, whether buyers will continue the January trend back towards the .9900 and parity figures.
--Written by Austin Sealey, Market Analyst for DailyFX.com
Contact and follow Austin on Twitter @AustinKarlFX


