


Gold Prices, XAU/USD - Technical Forecast
- Gold prices soar in best week since June 2019 as bond yields drop
- Medium-term XAU/USD technical outlook bullish, 2013 high eyed
- Week ahead will be closely watched for signals if prices could fall
Gold Weekly Recap
Gold prices experienced the most-aggressive week since June, rising over 3.9 percent heading into Friday’s close. On that day alone, the yellow metal soared over 1.6% as prices closed at their highest since February 2013. From a fundamental perspective, anti-fiat XAU/USD climbed as U.S. front-end government bond yields tumbled. Amid the coronavirus outbreak, the markets are almost fully pricing in 2 rate cuts by the end of this year from the Federal Reserve. That bodes relatively well for gold given that it has no associated yield.

Gold Price Technical Background
Generally speaking, XAU/USD has been speeding up the break above falling resistance which the latter can be traced back towards the end of 2011. The pace of gains have climbed substantially since 2019, the year in which rate cuts permeated from central banks across the world in an effort to support growth and thus boost inflation. Prices are aiming for the 2013 peak as the yellow metal continues to reverse the former downtrend. Maintaining the near-term and medium-term uptrend are multiple rising support lines.
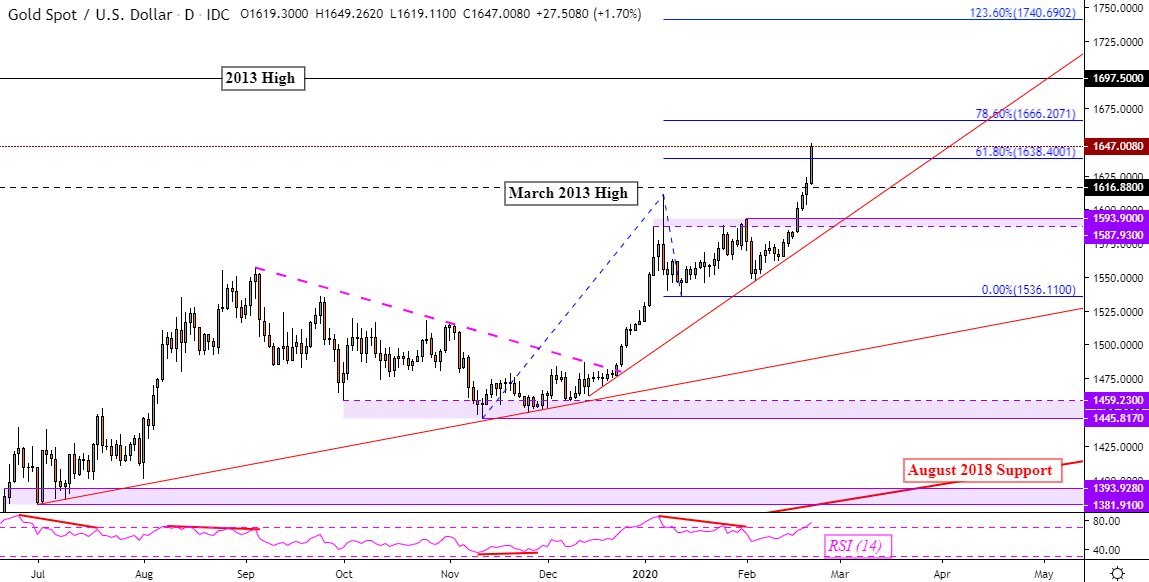
XAU/USD Weekly Chart

Gold Chart Created in TradingView
Gold Medium-Term Outlook
With that in mind, where to from here? The gold technical outlook is clearly bullish from a medium-term perspective. Price action in the week ahead could determine if that forecast is at risk and it will be important to watch a couple of key technical barriers. I would argue that the near-term uptrend is being maintained by rising support from December. If there are declines over the next 5 days and the latter holds, that will likely keep the short-term technical bias to the upside.
Keep a close eye on the psychological barrier between 1587 to 1593 in the event of a turn lower as it may also work to keep downside progress at bay. Immediate support appears to be the 61.80% Fibonacci extension level at 1638. Above sits the 78.6% area at 1666 along gold’s way to the 2013 high at 1697. The lack of RSI divergence shows that there is momentum behind the metal’s push for the time being.
XAU/USD Daily Chart
Gold Chart Created in TradingView
Gold Near-Term Outlook
Zooming in further on the 4-hour chart can give a better picture of what may be in store in the week ahead specifically. Here, I have drawn rising support from the middle of February which is maintaining the immediate uptrend – pink line below. Like with the daily chart, there is no presence of RSI divergence which shows that momentum is in gold’s favor. If prices close under 1638 (mentioned above), that may shift the immediate outlook bearish towards the pink line. Confirming a close under the March 2013 high would thus open the door to revisiting rising support from December.
| Change in | Longs | Shorts | OI |
| Daily | 1% | -3% | -1% |
| Weekly | 2% | -8% | -2% |
XAU/USD 4-Hour Chart
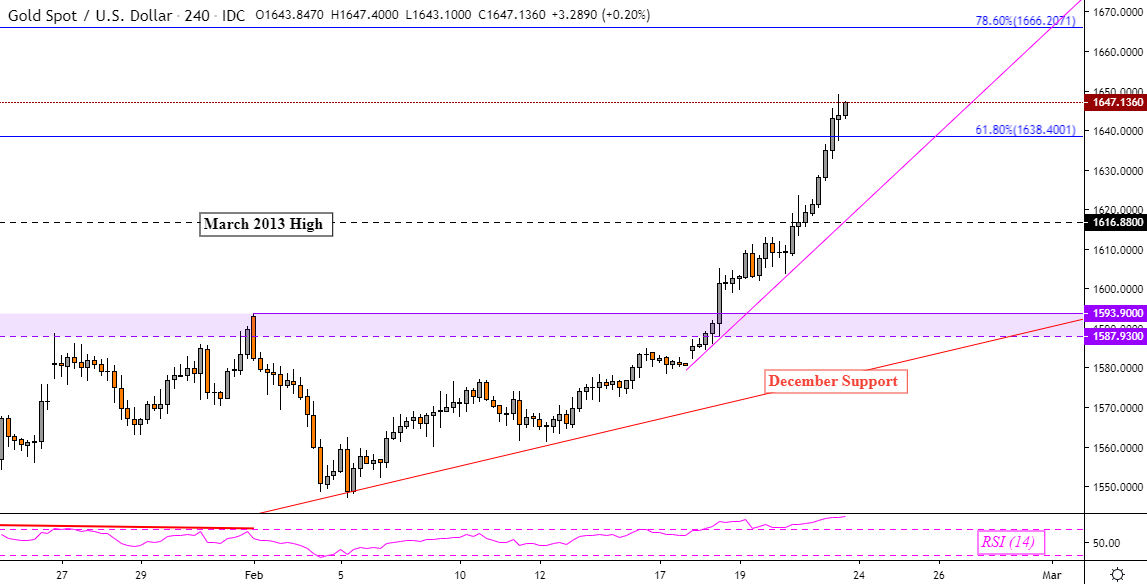
Gold Chart Created in TradingView
--- Written by Daniel Dubrovsky, Currency Analyst for DailyFX.com
To contact Daniel, use the comments section below or @ddubrovskyFX on Twitter


