


AUD/USD TECHNICAL FORECAST: NEUTRAL
- Australian Dollar breaks December trend support, eyes bearish resumption
- Confirmation needed on a break of rising channel from October 2019 low
- Recent gains may mark repeat of late-2018 “re-sloping” of the downtrend
Get help building confidence in your AUD/USD trading strategy with our free guide!
The Australian Dollar extended lower as expected after the formation of a bearish Evening Star candlestick pattern and subsequent break of upward-sloping support guiding December’s rally. The move has paused on a retest of former resistance guiding the descent from the November 2018 high, with a spirited pull-up through the 0.6865-81 congestion area suggesting scope for a higher bounce.
The first layer of resistance thereafter is in the 0.6930-39 zone. Breaking above that on a daily closing basis looks like to open the door for a test of the December 31 swing high at 0.7032. Such a move would effectively reset the immediate breakdown, neutralizing the case for immediate follow-through but falling short of a convincing long-side signal. Clearing the peak on a closing basis is probably a pre-requisite for that.
AUD/USD Daily Price Chart

AUD/USD daily chart created with TradingView
On the other hand, any returning selling pressure probably needs to push AUD/USD through support at the bottom of the rising channel broadly containing price action since early October 2019. That would make a compelling case for lasting bearish resumption, signaling that the longer-term descent from the January 2018 high has been re-engaged.
That would mark a similar scenario to the “re-sloping” of the decline before continuation in late 2018. An orderly stair-step lower for much of that year found a bottom in October. Prices bounced to breach trend resistance only to find a top shortly thereafter and extend downward, albeit at a different grade. The corrective rise amounted to 5.3 percent, analogous to the 5.4 percent upswing most recently.
AUD/USD Weekly Price Chart
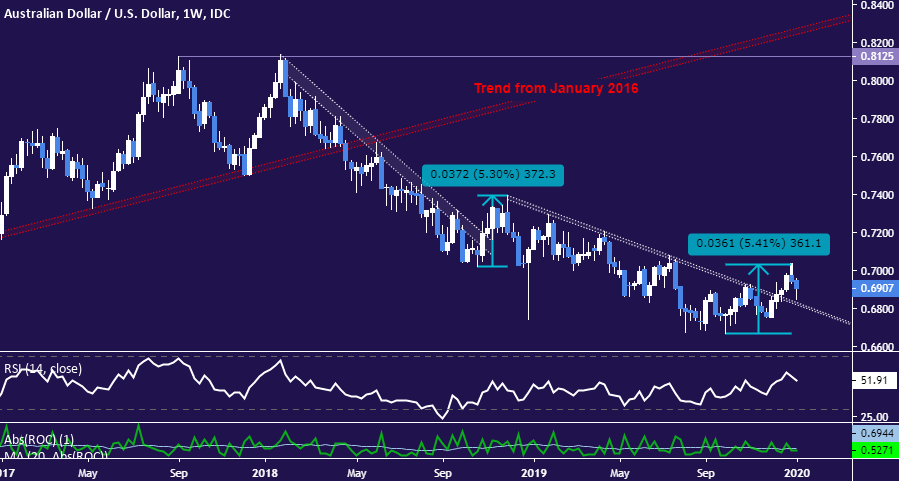
AUD/USD weekly chart created with TradingView
--- Written by Ilya Spivak, Sr. Currency Strategist for DailyFX.com
To contact Ilya, use the comments section below or @IlyaSpivak on Twitter
AUSTRALIAN DOLLAR TRADING RESOURCES
- Just getting started? See our beginners’ guide for FX traders
- Having trouble with your strategy? Here’s the #1 mistake that traders make
- Join a free live webinar and have your trading questions answered
OTHER TECHNICAL FORECASTS:


