


GOLD PRICES OUTLOOK: BULLISH
- Gold prices may continue to rise as XAU/USD approaches key resistance
- Clearing the multi-layered ceiling opens the door to another bullish spike
- However, technical cues on a monthly chart are sending worrying signals
Gold prices have risen a little over three percent after clearing the September descending resistance channel, around the same time the precious metal clocked in six-year highs. XAU/USD is now hovering just below the 1532.01-1535 resistance range (white dotted lines). If gold prices clear this area with follow-through, it could open the door to re-testing the multi-layered ceiling between 1551.96 and 1557.10.
Gold Prices – Daily Chart
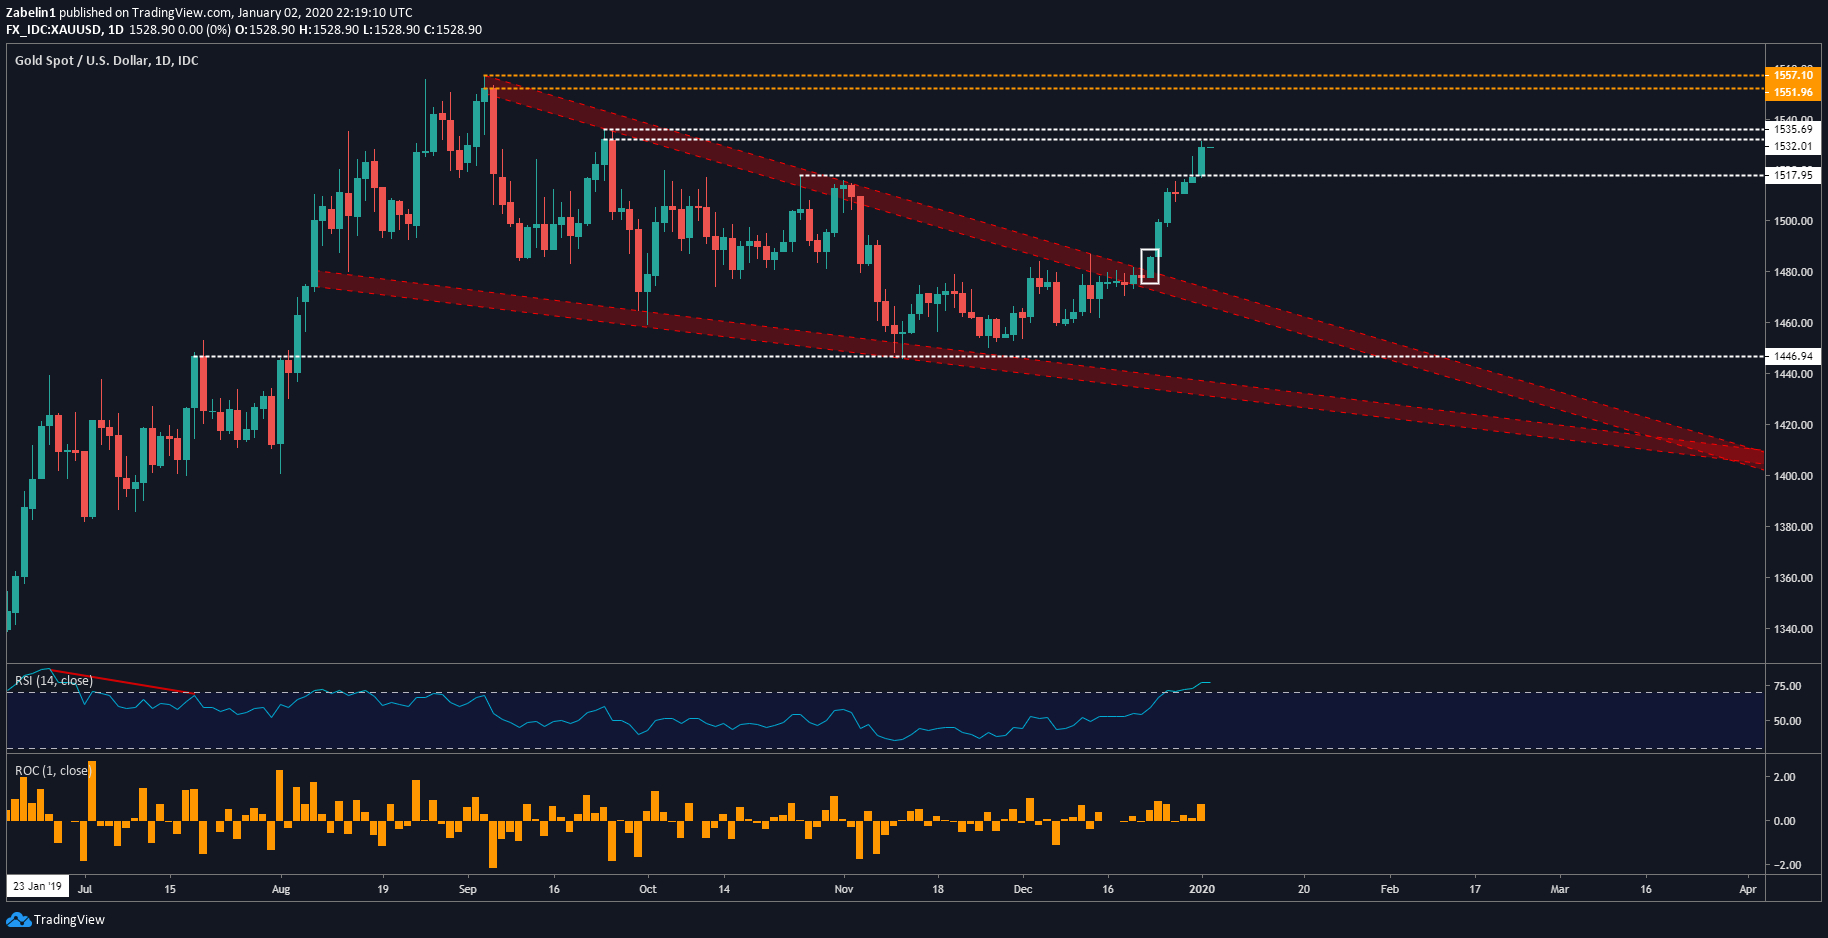
Gold prices chart created using TradingView
Looking at a weekly chart shows the XAU/USD has been on a steady rise since late-2016, with the slope of appreciation steeping in May 2019 before buying pressure surrendered and a selloff ensued. Following the bearish correction, the yellow metal has made a recovery after bottoming out around 1445.82 (gold-dotted line), close to the 23.6 percent Fibonacci extension level.
Gold Prices – Weekly Chart

Gold prices chart created using TradingView
However, zooming out to a monthly chart shows what could be a discouraging picture for gold bulls. Negative RSI divergence show upside momentum since August has been ebbing while gold prices trade above that month’s close. While this does not necessarily precede a turn lower, the incongruity between momentum and prices may be something traders will begin monitoring with greater scrutiny.
Gold Prices – Monthly Chart

Gold prices chart created using TradingView
GOLD TRADING RESOURCES
--- Written by Dimitri Zabelin, Jr Currency Analyst for DailyFX.com
To contact Dimitri, use the comments section below or @ZabelinDimitri on Twitter


