


Technical Crude Oil Price Talking Points:
- The ONE Thing: A bounce could very well be a trap for bulls. There is a lot of resistance near $56/bbl.-$59/bbl. that could bring back sellers.
- Per IGCS, Crude sentiment favors a bounce, but long-term bias remains negative
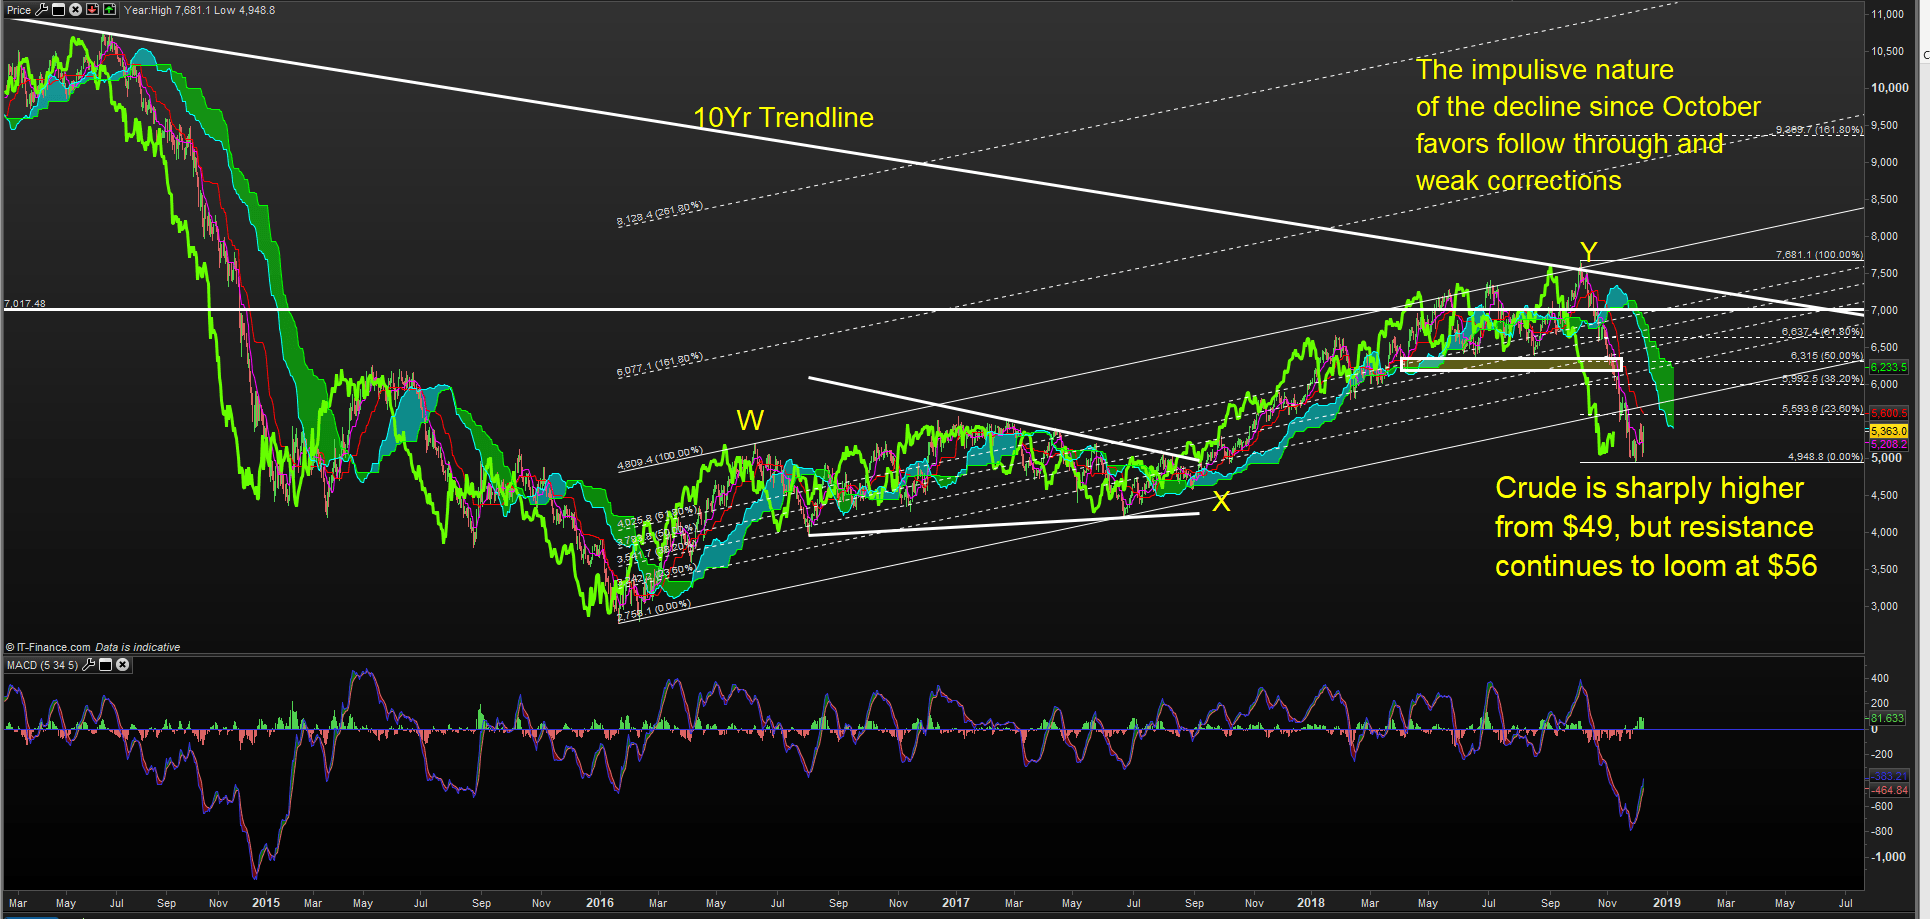
- The Technical Picture: Selling rips appear to be preferred below the rising channel that was aggressively broken in this Q4 bear market in oil shown on the chart below. Crude is sharply higher from $49, but resistance continues to loom at $56New targets surface at $42-39, which becomes increasingly likely if US Dollar strength can continue.
Technical Forecast for <USOIL>: Bearish
Data Source: Bloomberg
Technical traders soon learn that moves rarely happen in isolation. In Elliott Wave (learn more here) moves in the direction of the trend tend to take place in five ways, and counter-trend moves tend to happen in three waves.
Regardless of whether you think this is a new bear market or a bull market correction (the latter is getting harder to argue), there appears to be more selling to come. However, a bounce, albeit a small bounce relative to the decline, could be taking form post-OPEC+.
Looking at the chart above, the clear resistance for such a bounce to terminate utilizing Ichimoku as a guide would be $56/bbl. (the 26-day midpoint and Kijun sen) or into the cloud near the 38.2% retracement of the October-November decline near $59/bbl. The latter level is also well within the cloud, which tends to catch the first true retracement before trend continuation.
Bottom buyers will no doubt be encouraged by the ~5% rally on Friday, but resistance continues to loom large at $56/59 with a worsening global economic growth outlook that could cause the wind to blow in the bears favor soon.
Sentiment Favors A Bounce, But Long-Term Bias Remains Negative
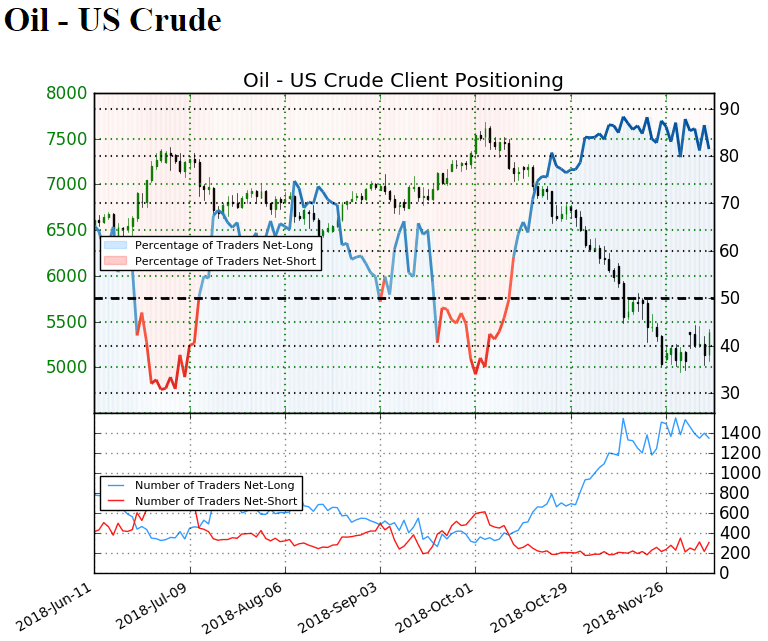
Oil - US Crude: Retail trader data shows 81.5% of traders are net-long with the ratio of traders long to short at 4.4 to 1.
In fact, traders have remained net-long since Oct 11 when Oil - US Crude traded near 7621.0; price has moved 29.5% lower since then. The number of traders net-long is 3.2% higher than yesterday and 7.2% lower from last week, while the number of traders net-short is 9.3% higher than yesterday and 6.1% lower from last week.
We typically take a contrarian view to crowd sentiment, and the fact traders are net-long suggests Oil - US Crude prices may continue to fall. Yet traders are less net-long than yesterday and compared with last week. Recent changes in sentiment warn that the current Oil - US Crude price trend may soon reverse higher despite the fact traders remain net-long (emphasis mine.)
---Written by Tyler Yell, CMT
Tyler Yell is a Chartered Market Technician. Tyler provides Technical analysis that is powered by fundamental factors on key markets as well as trading educational resources. Read more of Tyler’s Technical reports via his bio page.
Communicate with Tyler and have your shout below by posting in the comments area. Feel free to include your market views as well.
Checkout DailyFX’s New Podcast: Trading Global Market’s Decoded on iTunes
Talk markets on twitter @ForexYell
Other Weekly Technical Forecast:
Australian Dollar Forecast – AUD/USD, AUD/JPY and EUR/AUD Trend Lines Broken
British Pound Forecast – Sterling Remains Weak
US Dollar Forecast – Dollar Wind Up Threatens to Resolve with a Break Before 2018 Ends
Equity Forecast – Technical Forecast for the S&P 500, Dow Jones, DAX 30 & FTSE


