


-- Subscribe to Jamie Saettele's distribution list in order to receive a free report to your inbox several times a week.
--Looking for ideas and forecasts? Visit the DailyFX guides and forecasts page. Also, check out the webinar schedule.
--Are you positioned with the crowd? Check the IG Client Sentiment page to find out.
--Technical Weekly wishes to share some monthly charts in today’s report as a new month begins on Monday.
Monthly (linear)

Chart Prepared by Jamie Saettele, CMT
See REAL TIME trader positioning
“I’ve noted long term EUR/USD bottoming conditions recently such as the key reversal in January, divergence with RSI (monthly and weekly) and the channeling decline. Price needs to take out the blue trendline in order to get bullish though because the rally from January is left as a 3 wave advance and ‘counts’ as a 4th wave within a 5 wave decline from the 2016 high. The implication is that a 5th wave lower is possible to at least 1.0200 (measured target based on wave 1 = wave 5).” You can view the blue line in the prior week’s FXTW but it’s been broken (on the gap). French election or not, this all seems to be part of a broad bottoming attempt that started in March 2015. The underside of the 1985-2000 trendline (linear) is being tested now so near term downside may be in store. The underside of that line on log scale is in the 1.2000s.
EUR/USD
Monthly (log)

Chart Prepared by Jamie Saettele, CMT
GBP/USD
Monthly (log)

Chart Prepared by Jamie Saettele, CMT
See REAL TIME trader positioning
Recent comments have noted that “for the 3rd time in history, a string of 6 consecutive down quarters has ended (see here). Focus is towards at least 1.3400-1.3500. The 52 week average and the 9/30/2016 uncovered close at 1.2965/75 should be noted as a minor hurdle.” The minor hurdle is being tested now. Allowing for a pause (pull back), focus is towards the mentioned 1.3500 before real problems arise.
Weekly (linear)

Chart Prepared by Jamie Saettele, CMT
See REAL TIME trader positioning
Every AUD/USD poke into .7700-.7800 over the last year has failed. The main consideration for resistance up there are from parallels. As long as price is below the parallel, longs are fighting an uphill battle. After the February top, I noted that “the dip could extend to the October and December 2015 highs at .7385.” That level is in play barring a breakout through the top of the range. I’ll note that 67 weeks have passed since the January 2016 low. The final low within the bottoming sequence in the early 2000s was 70 weeks from the initial low. Momentum is much weaker now than it was then but the timing is interesting.
Monthly (linear)
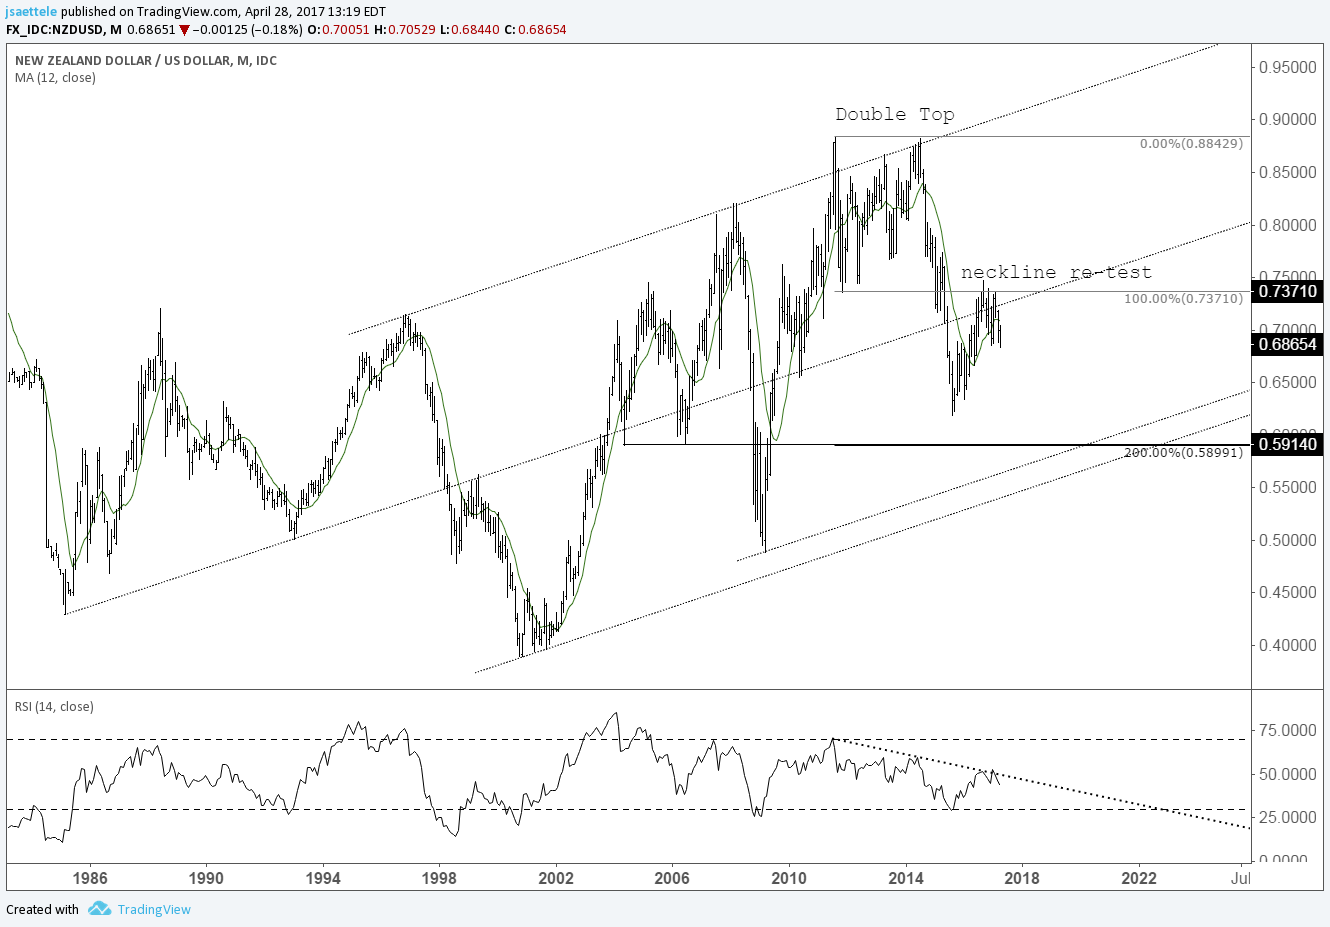
Chart Prepared by Jamie Saettele, CMT
See REAL TIME trader positioning
Don’t forget about the 2015-2016 trendline near .6780 in Kiwi. Bigger picture, I remain non-committal. Is the rally from August 2015 countertrend or a new trend? The 2016 and YTD highs are at major resistance from the 2011 low and a double top target is still unmet at .5899. A break under the 2015-2016 trendline (.6780) would tilt the boat in favor of more downside. Strength through .7090 is needed in order to turn the near term picture positive.
USD/JPY
Weekly (linear)
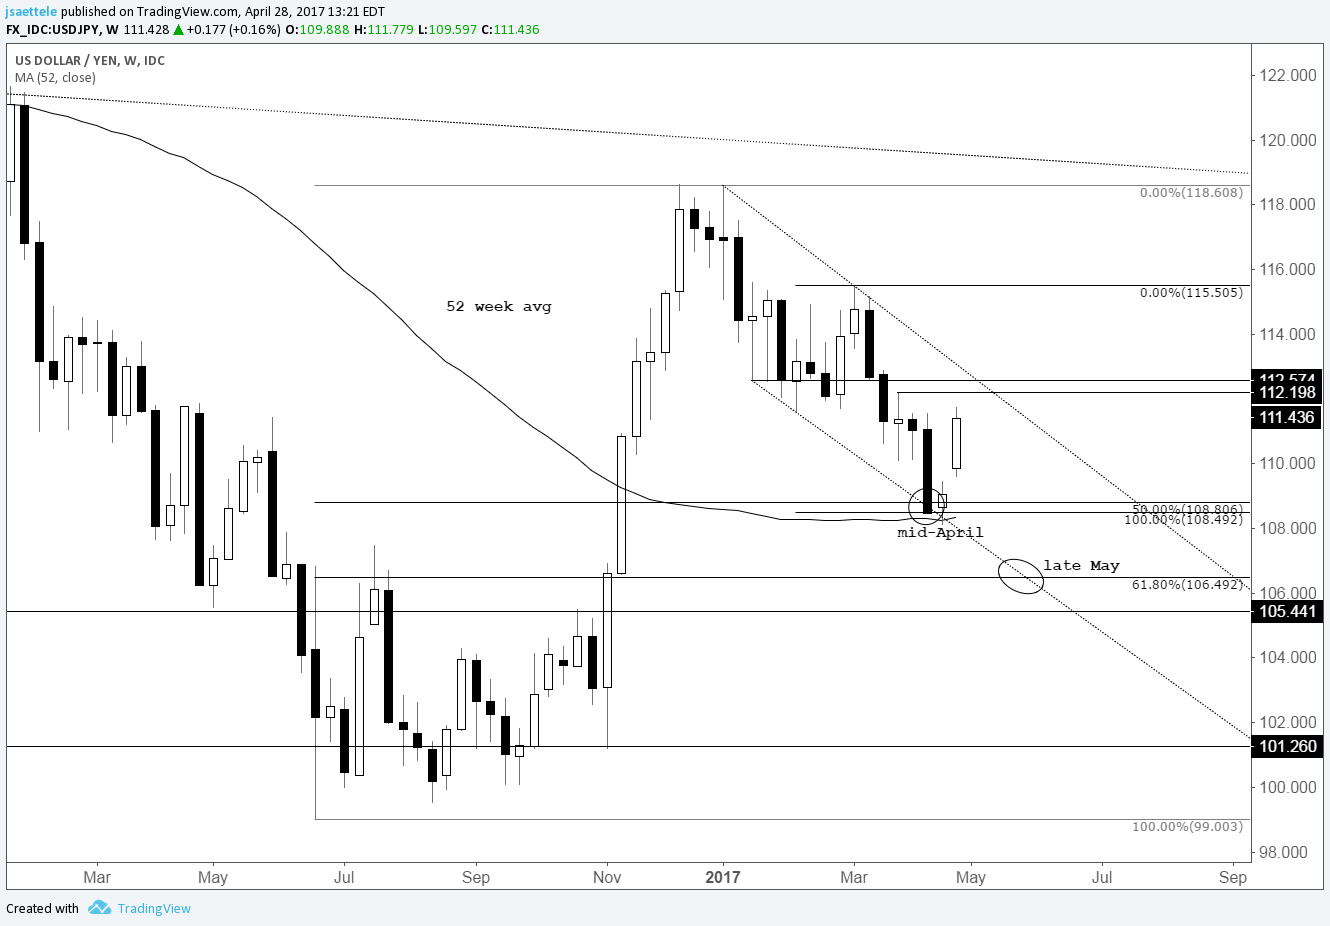
Chart Prepared by Jamie Saettele, CMT
See REAL TIME trader positioning
The following was put forth in the USD/JPY Q2 forecast. “A major USD/JPY level could be met in April. The 52 week average (support and resistance for years) is near 108.30 and the 50% retracement of the decline is at 108.81 (the 1991 high was a 50% retracement of the 1990 decline by the way). The decline from the January high would consist of 2 equal legs at 108.49. This zone (108.30/81) intersects with the developing channel from the January high in mid-April.” The level has been met and USD/JPY is nearly 4 big figures off of the low (to high). Price above 110.10 (lows in late March and early April) is a good sign. The upper channel line remains resistance.
USD/CAD
Monthly (linear)
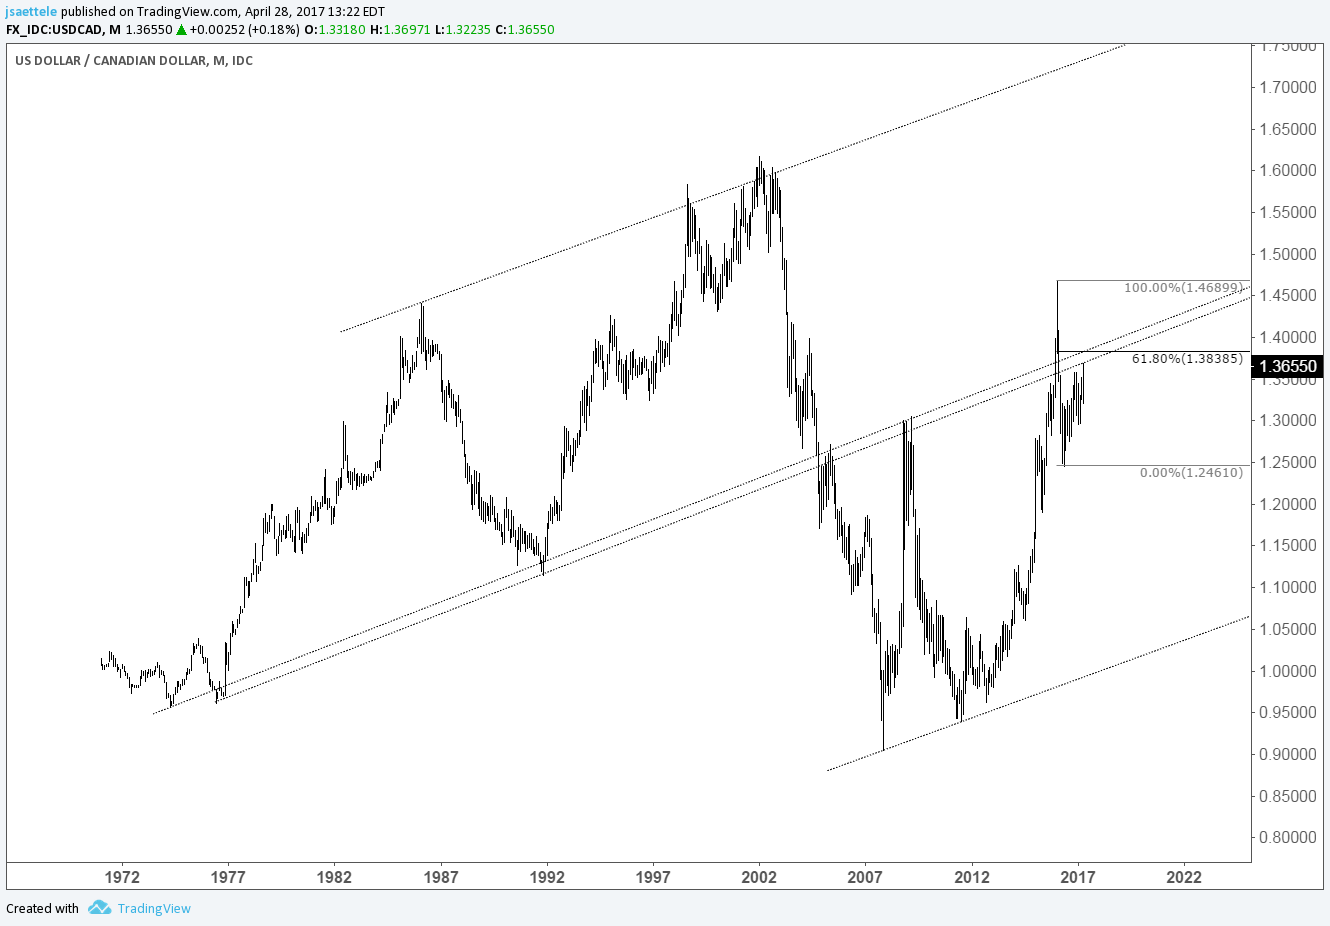
Chart Prepared by Jamie Saettele, CMT
See REAL TIME trader positioning
Last week’s update noted that “USD/CAD has revisited the highs so the bull trap possibility is back on the table. The long term parallel (support in October 2015 and resistance in late 2016) is near 1.3700. The 61.8% of the drop from January 2016 is 1.3838.” The lower end of the range has been met (high was 1.3697 today). Some of the biggest pivots in history have occurred on the long term slope lines shown above. We’re in the vicinity so pay attention.
Monthly (log)
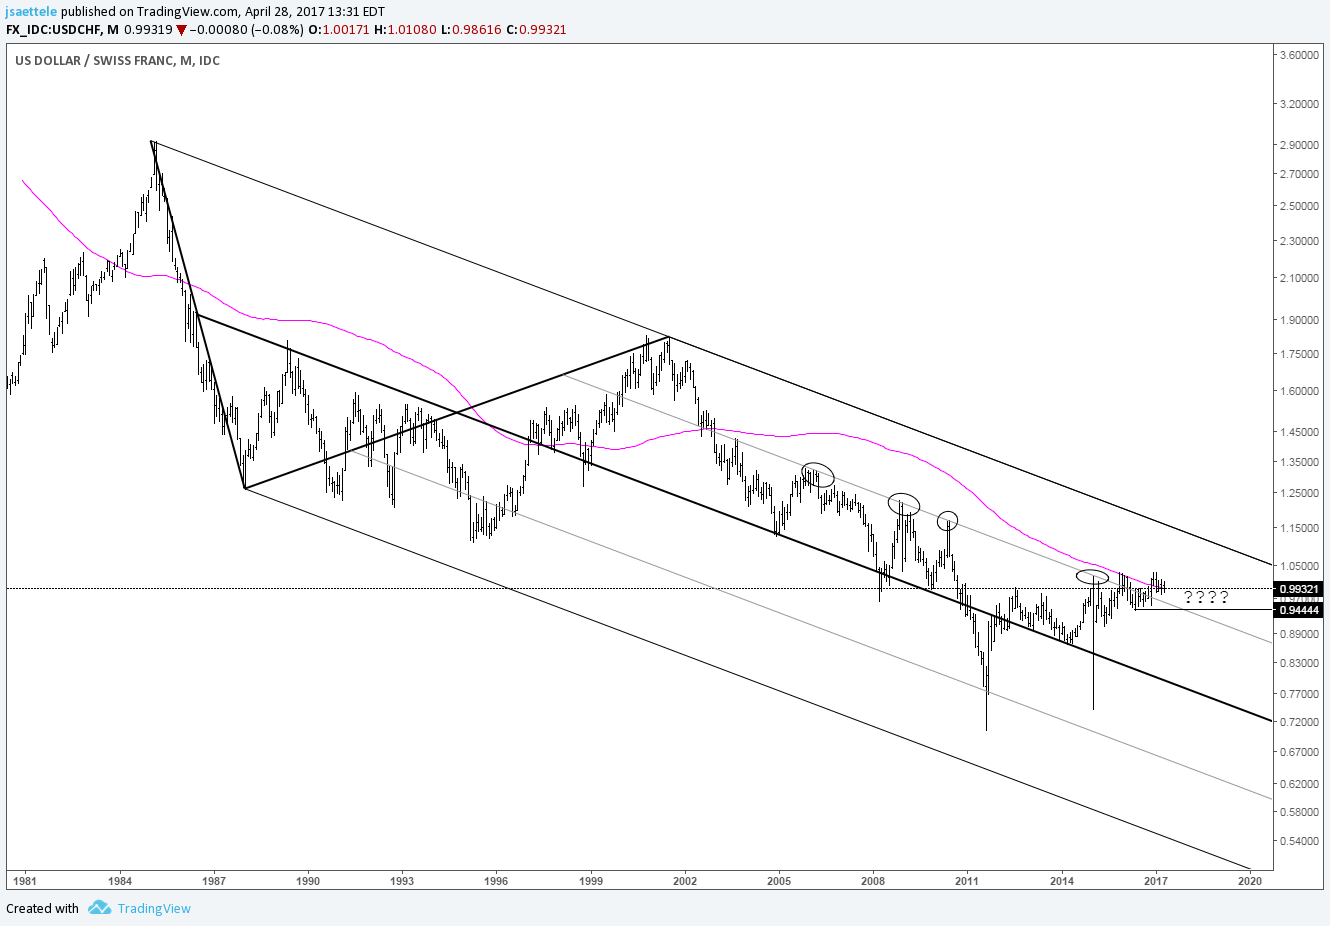
Chart Prepared by Jamie Saettele, CMT
See REAL TIME trader positioning
USD/CHF is trading at its 10 year average…and 3 year average…and 1 year average (10 year average shown on this chart). The point is that current USD/CHF conditions are trendless (thanks SNB). How long does this last? Don’t know but the charts indicate a breakout above a long term parallel in November thus focus is towards the upper parallel (near 1.1500). Failure to follow through on the breakout casts doubt on the validity of the interpretation.


