


- GBP/USD still pressured
- AUD/USD 3rd consecutive week with an ‘indecision’ candle at resistance
- USD/JPY back for more at well-defined 111.00/90 zone
-- Subscribe to Jamie Saettele's distribution list in order to receive a free report to your inbox several times a week.
Weekly
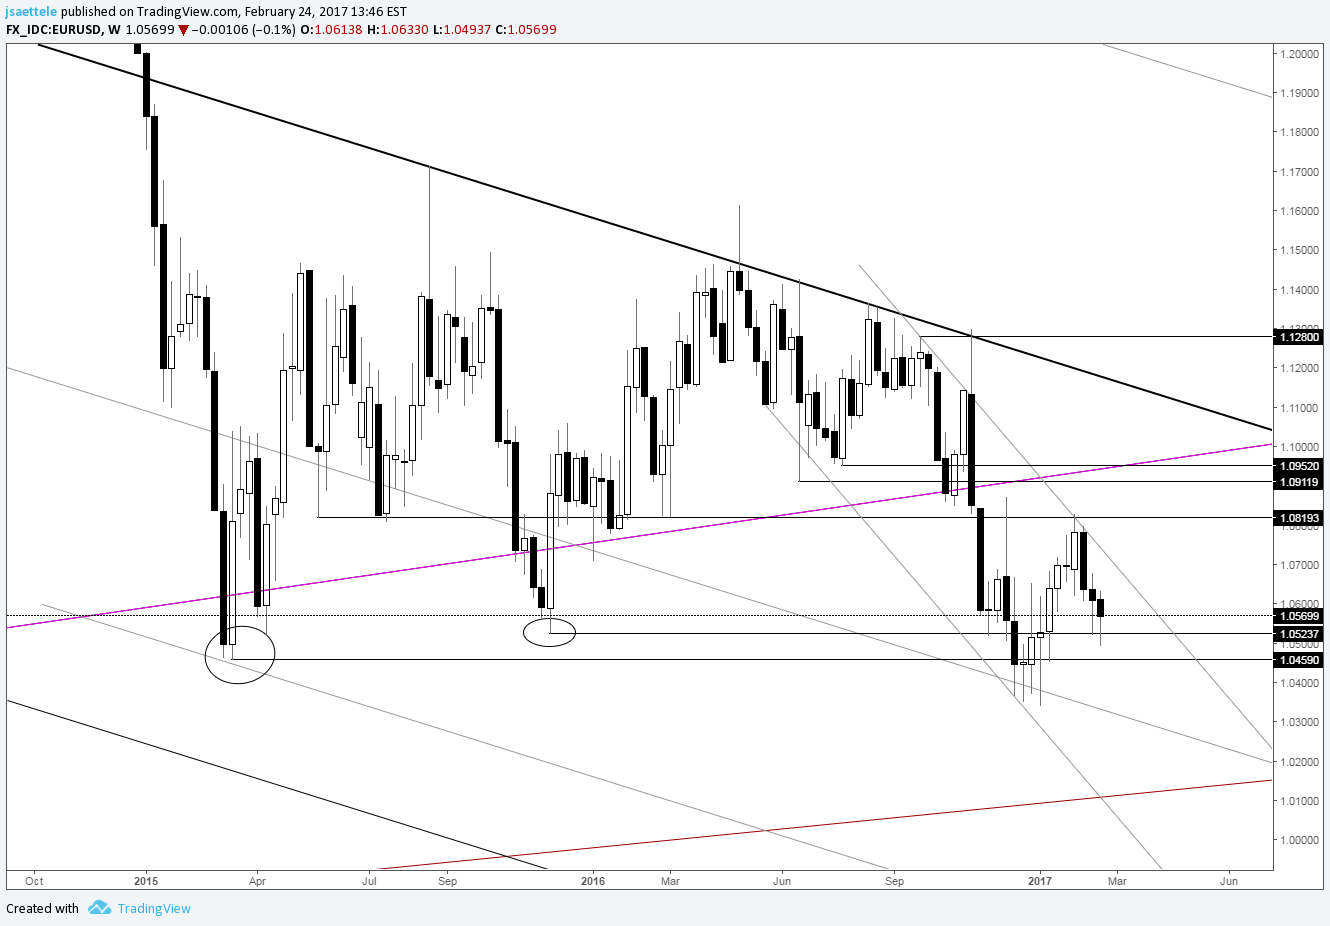
Chart Prepared by Jamie Saettele, CMT
See REAL TIME trader positioning
1.0530 and 1.0460s. Those are the 2 levels that I’m paying attention to. 1.0530 is the December 2015 low and 61.8% of the rally from the January low. 1.0460s is the March 2015 low and year open price. If the rate trades out of the channel that defines weakness from the 2016 high then the summer lows at 1.0910/50 represent the next test. If fresh lows are registered (not my base case given the first day of the year reversal), then there is a long term parallel to be aware of just above 1.0100.
Check out the DailyFX Trading Guides and webinars for ideas and education.
Weekly
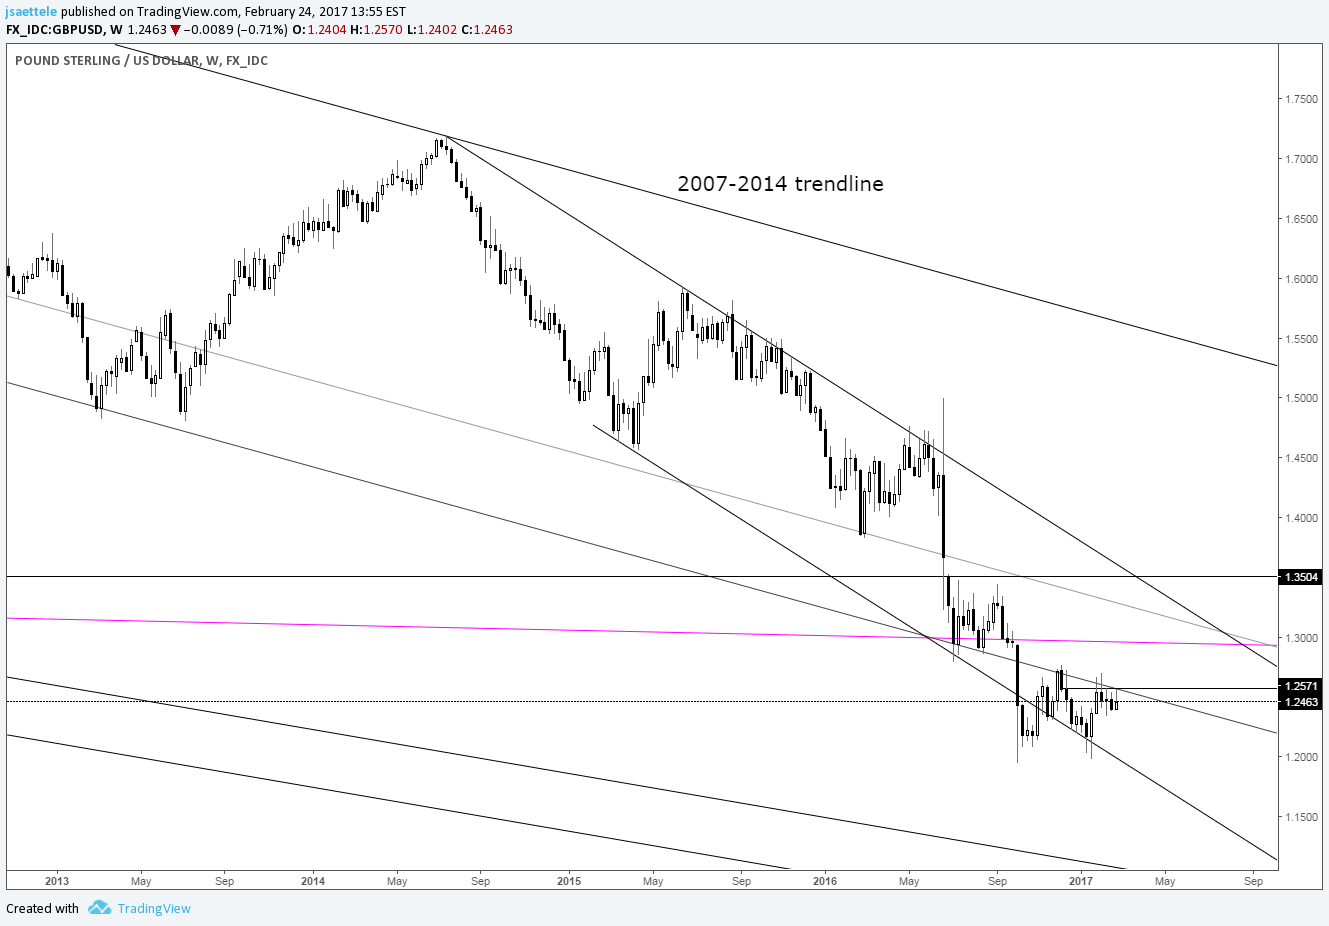
Chart Prepared by Jamie Saettele, CMT
See REAL TIME trader positioning
The last update noted that “the high is at the November high and a long term parallel so it could take some time to work out the kinks before an extension higher.” Cable continues to trade under the mentioned parallel and as such remains pressured. A move through the parallel (higher) would indicate an important behavior change and trigger a double bottom with the October and January lows (target 1.3400-1.3500).
AUD/USD
Weekly
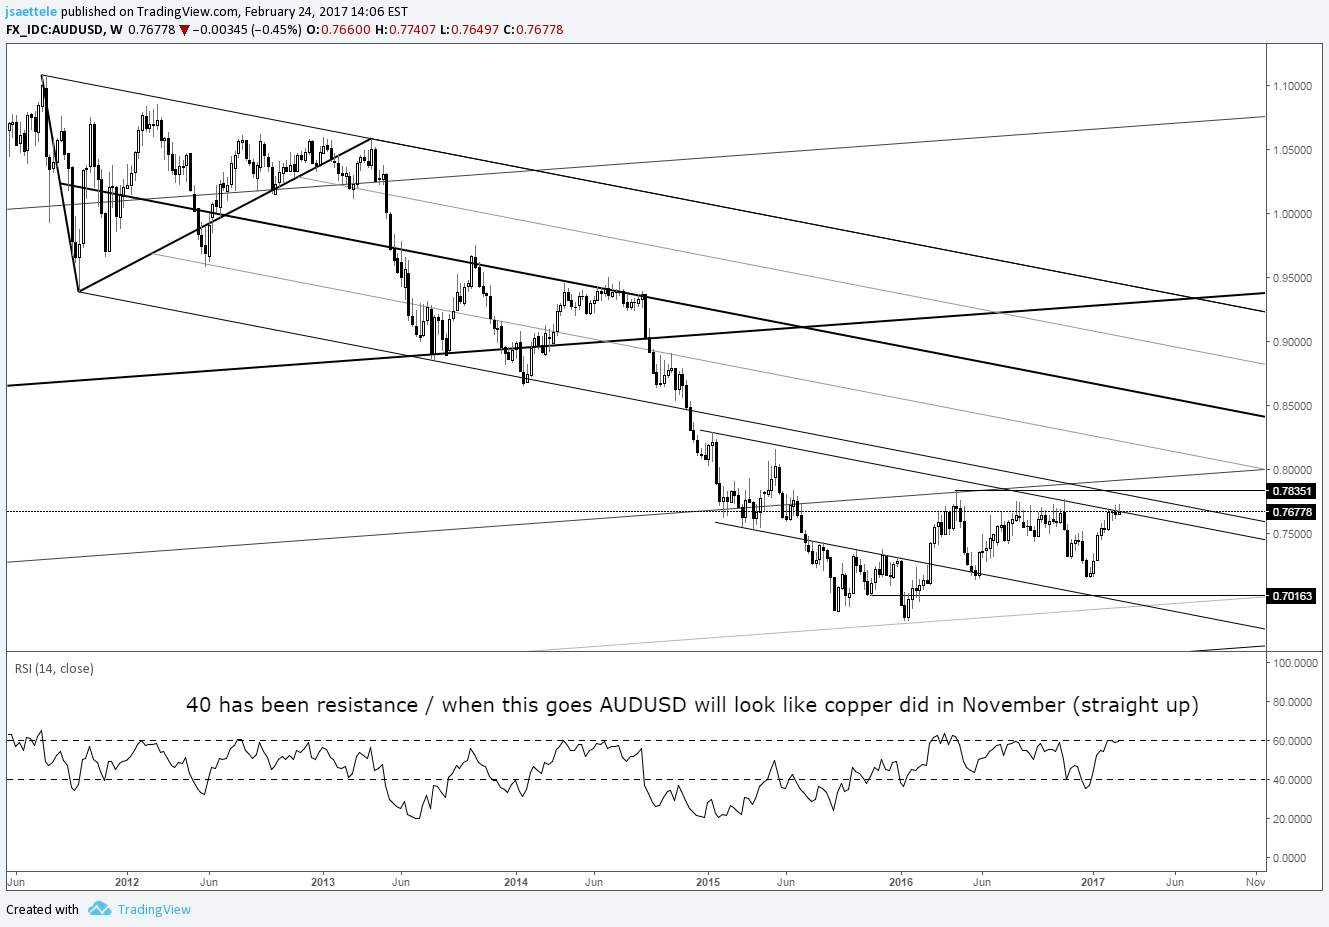
Chart Prepared by Jamie Saettele, CMT
See REAL TIME trader positioning
The view that an important bullish base has formed remains but the action of the last 3 (was 1, then 2, and now 3) weeks at resistance (.7700-.7835) warns of a pause in what has been the trend of 2017. Keep the RSI comments in mind. “Weekly RSI has peaked at/near 60 on every bounce since after the 2011 peak. RSI at the 2 most recent lows (January 2016 and January 2017) are near 40, which is a positive. In other words, the momentum profile has improved which increases risk of an upside break.” ALSO, the current 52 week range (weekly closes) is 7.1%. This is the smallest 52 week range since October 2005 and at the lower end of its historical range. The implication is that AUD/USD is on the verge of transitioning from range contraction conditions to range expansion conditions (trend).
Weekly

Chart Prepared by Jamie Saettele, CMT
See REAL TIME trader positioning
Since reversing sharply (outside week reversal) 2 weeks ago, Kiwi has quietly consolidated. Bigger picture, Kiwi remains capped by the upper end of its 2016 range and a channel line. As noted last week, “peaks in NZD/USD since the summer have been anything but clean but that may be changing as Friday’s high was right at the December high. Clean reactions at clean levels is a plus. I lean towards the downside with focus on the 55 week average (maybe a bit below).”
USD/JPY
Weekly
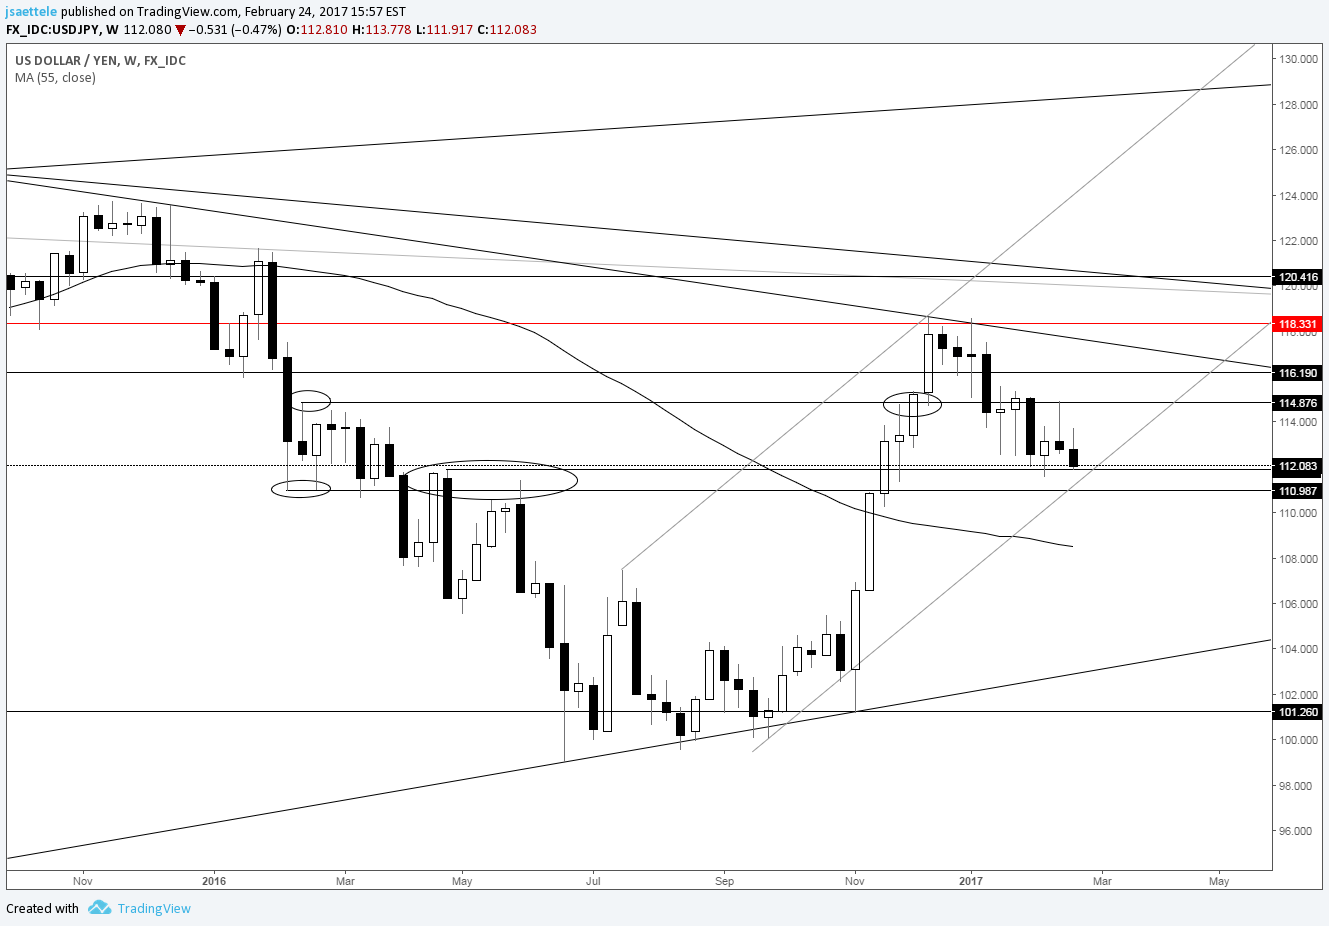
Chart Prepared by Jamie Saettele, CMT
See REAL TIME trader positioning
The USD/JPY close is the lowest since the first week of December. Possible channel support resides just below the market along with the February 2016 low at 110.99 and April 2016 high at 111.90. A reversal from this zone would be viewed as evidence that a broader range remains in play. Failure to hold would shift focus to the 200 week and 55 week averages near 109.80 and 108.50. I’d pay more attention to the 55 week near 108.50 because the 50% retracement of the rally from the 2016 low is 108.83.
Weekly

Chart Prepared by Jamie Saettele, CMT
See REAL TIME trader positioning
USD/CAD has spent almost all of 2017 testing support from a long term parallel. From a momentum perspective, RSI failed at 60 on the latest rally. This characteristic is associated with either a downtrend or sideways trend. Also, the rally from May 2016 is corrective so the bias is for impulsive weakness but I don’t like being bearish into support (parallels). Weakness below 1.2835 would warrant a bearish bias towards the 5 year trendline in the low 1.2000s.
Weekly

Chart Prepared by Jamie Saettele, CMT
See REAL TIME trader positioning
USD/CHF remains supported above the 55 week average but the rate has tended to top in early-mid March the last few years. Generally, Swissie is trading in no-man’s land at the current level. The levels to know are the nearly 6 year trendline (.9850 on log scale and just above .9700 on arithmetic) and topside of the wedge near 1.0450 (line off of 2012 and 2015 highs). A break of one of these technical barriers ideally leads to one of the largest moves in many years.


