


-- Subscribe to Jamie Saettele's distribution list in order to receive a free report to your inbox several times a week.
Weekly
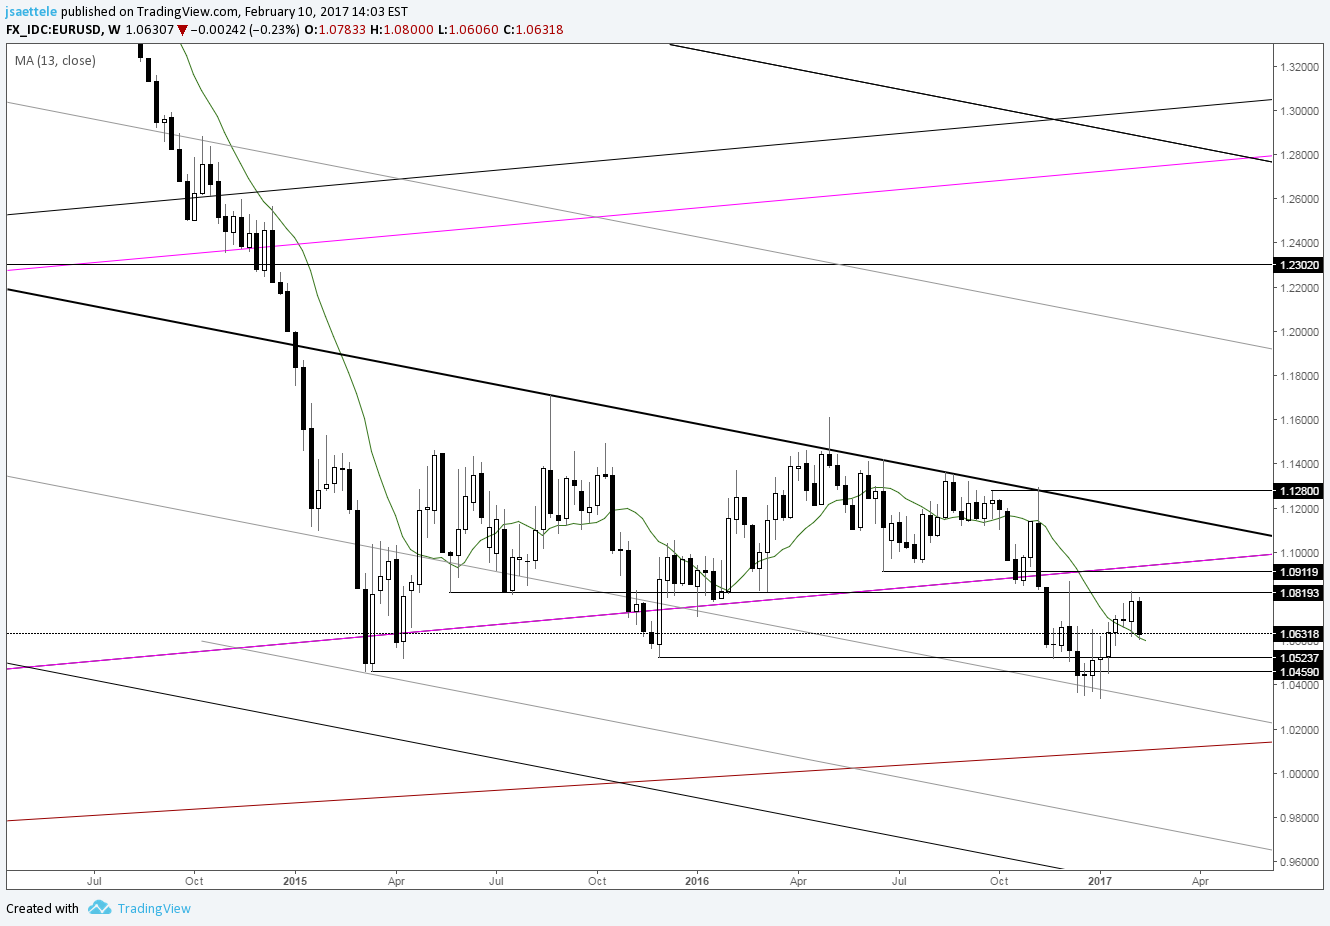
Chart Prepared by Jamie Saettele, CMT
See REAL TIME trader positioning
“Price wise, EUR/USD is fighting against 1.0820/50, which was support in 2015 and 2016. It’s a big level but consider upside as long as above this week’s low. If this week’s low is taken out then I’d still watch for support near 1.0462-1.0539 (2015 lows).” This week’s low was tagged so pay attention to the mentioned levels. Broadly speaking, I don’t have much of an opinion on immediate prospects. I think that EUR/USD is bottoming but am unsure if the low is in. A reversal on the first day, week, and month of the year is the best way for a market to reverse a major trend but upside from the low isn’t impressive (couldn’t even register an RSI above 70 on the daily for example).
Check out the DailyFX Trading Guides and webinars for ideas and education.
Weekly
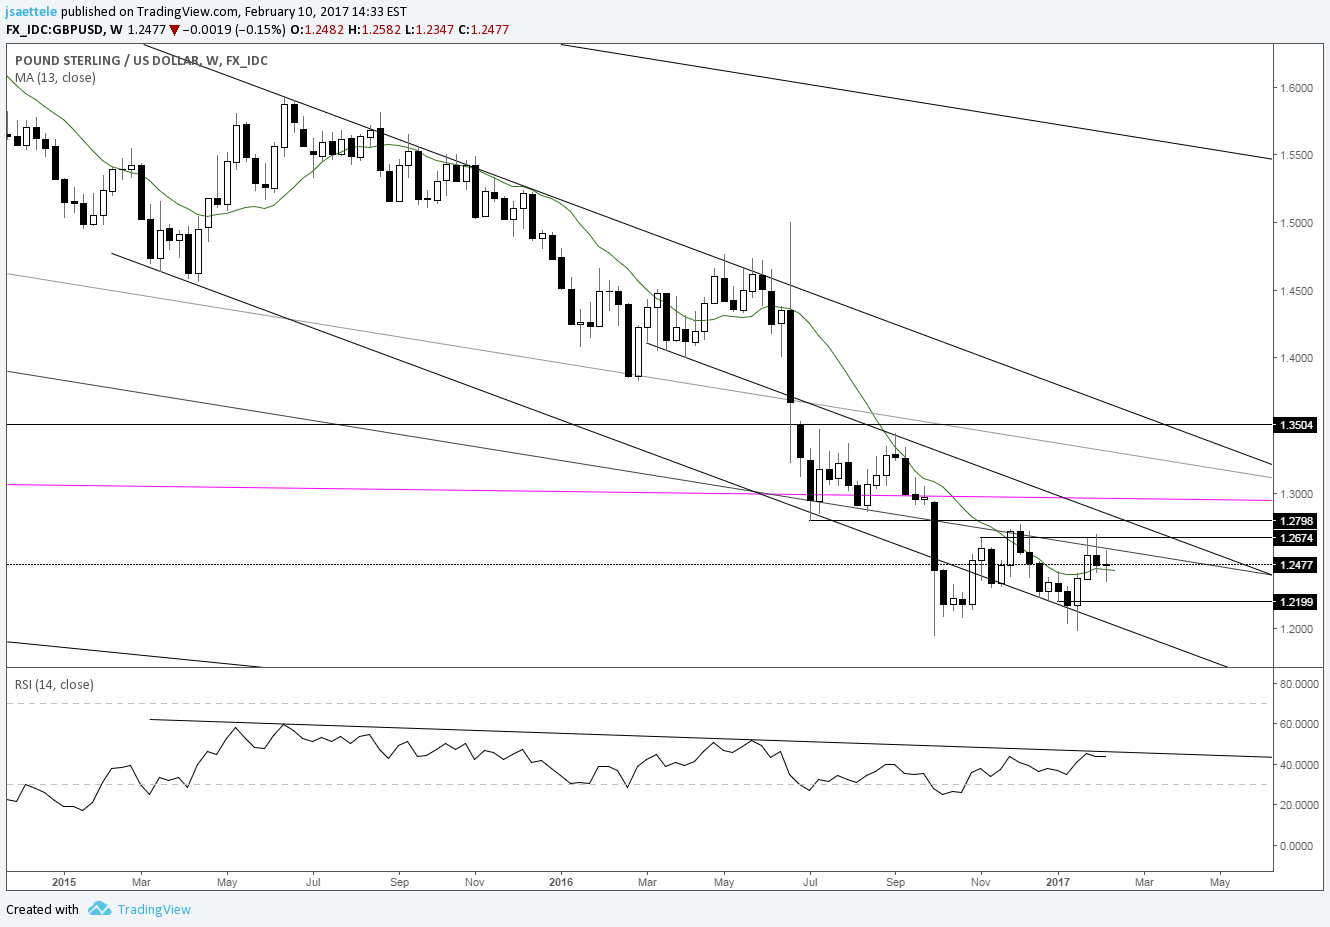
Chart Prepared by Jamie Saettele, CMT
See REAL TIME trader positioning
There is no change to the long term GBP/USD comments, which continues to consolidate following a sharp reversal. “Cable has followed through on the weekly reversal and closed above the 13 week average. The high is at the November high and a long term parallel so it could take some time to work out the kinks before an extension higher. The long term cycle is the most intriguing of all. “Did the 96 month (8 year) cycle low count just nail a major GBP/USD low (cycle is in February but give this some wiggle room)?
AUD/USD
Weekly

Chart Prepared by Jamie Saettele, CMT
See REAL TIME trader positioning
This week’s range was the smallest non-holiday range since August 2014. Weekly RSI has peaked at/near 60 on every bounce since after the 2011 peak. RSI at the 2 most recent lows (January 2016 and January 2017) are near 40, which is a positive. In other words, the momentum profile has improved which increases risk of an upside break. Previous comments are valid. “.7700-.7835 is going to be a battle for bulls. The zone is defined by long term parallels, upper end of the 2016 range. I think the level gives way but don’t know when (if you have an idea, please share).”
NZD/USD
Weekly

Chart Prepared by Jamie Saettele, CMT
See REAL TIME trader positioning
I wrote last week that “Kiwi is similar to Aussie in that the broader trend is higher but the market faces resistance right now. There is a good deal of horizontal consideration for supply between .7327 (highest 52 week close) and .7485 (2016 high). Original channel resistance (line slope based on 2015 and 2016 lows) is up here too. The zone is bolstered by lows in 2011 and 2012 as well. I don’t like being bullish into such a big zone.” Kiwi has sold off in kind. Pay attention to .7080 (13 week average and low of week that ended 1/20).
USD/JPY
Weekly

Chart Prepared by Jamie Saettele, CMT
See REAL TIME trader positioning
USD/JPY has turned up from well-defined support (April and May 2016 highs). I continue to assert that “USD/JPY is neither overly bullish nor bearish but rather range. The trendline / horizontal level above price and 110.67-111.90 range below price make for solid range barriers. Abandon ship below 110.25 though (11/22 low).” Levels on the upside to pay attention to are the same ones that have been influential throughout the last 2 years…basically near 115.00 and 116.00.
Weekly
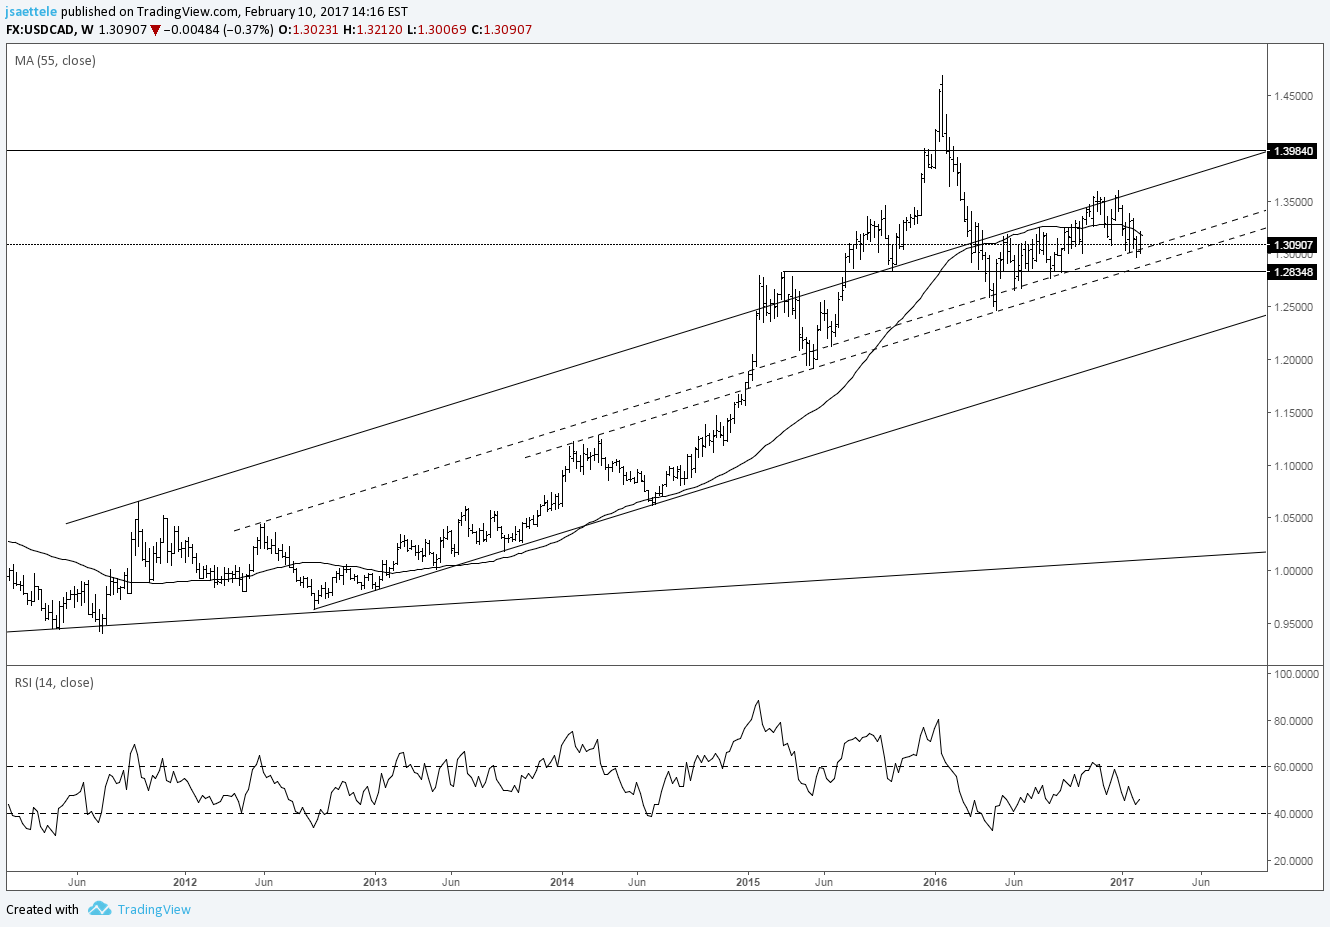
Chart Prepared by Jamie Saettele, CMT
See REAL TIME trader positioning
Stuck best describes USD/CAD at the moment. On one hand, the 55 week average has acted as resistance this week (the average has been support/resistance at times for years) but Loonie remains above long term parallels. From a momentum perspective, RSI failed at 60 on the latest rally. This characteristic is associated with either a downtrend or sideways trend. Also, the rally from May 2016 is corrective so the bias is for impulsive weakness but I don’t like being bearish into support (parallels).
Weekly
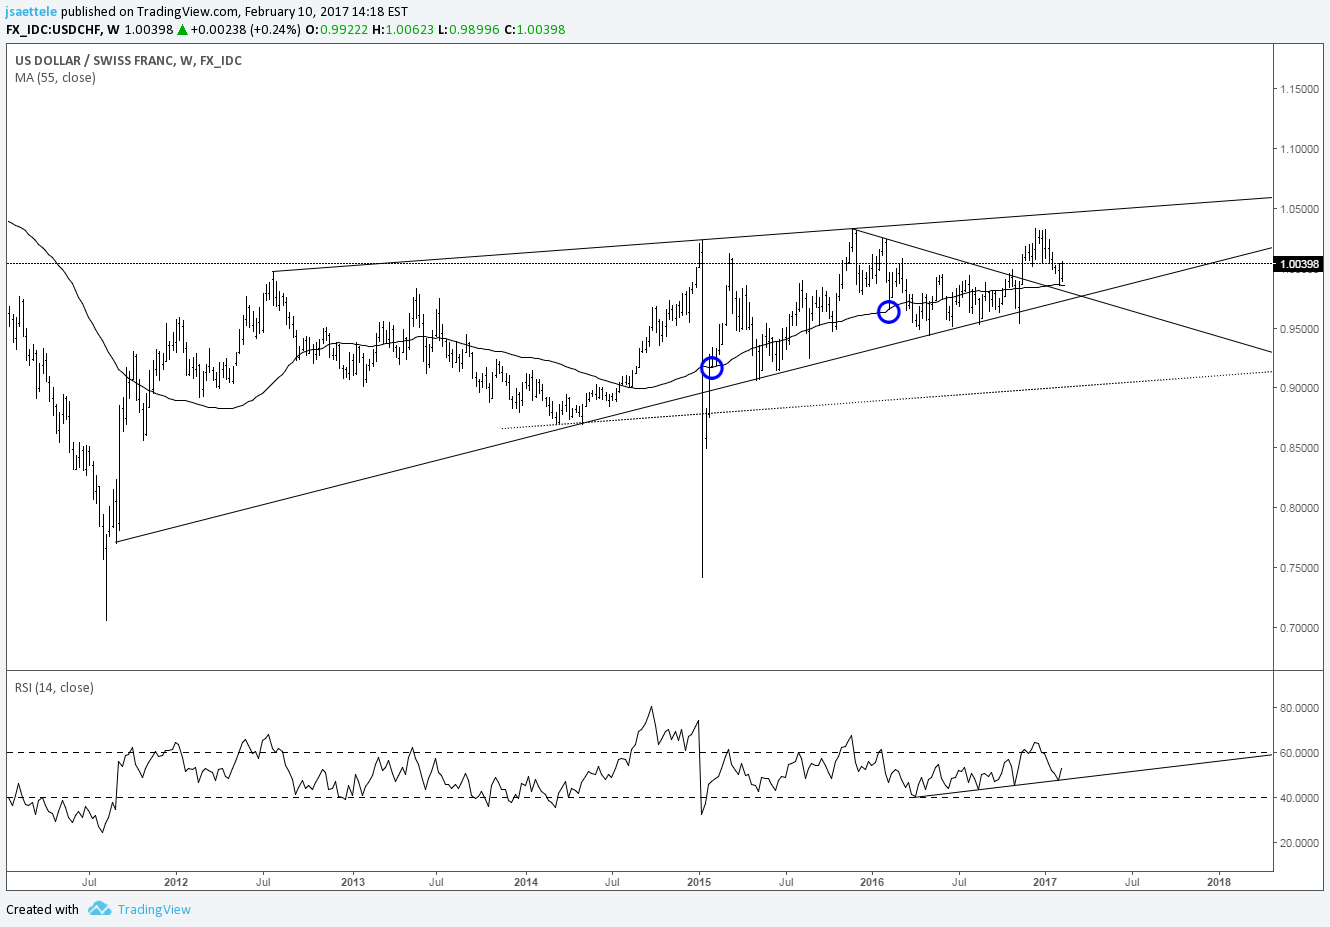
Chart Prepared by Jamie Saettele, CMT
See REAL TIME trader positioning
USD/CHF has bounced off of the 55 week average, as it has the previous 2 Februarys. I’m content to ‘think higher’ into late February/early March as Swissie has tended to top during that time period the last several years. “Broad upside potential is possible as long as price is above the 2011-2014 trendline. The trendline is near .9850 on log scale and just above .9700 on arithmetic. The topside of the wedge is worth knowing near 1.0450 (line off of 2012 and 2015 highs). Essentially, the wedge barriers are all I care about…all else is noise.”


