


-- Subscribe to Jamie Saettele's distribution list in order to receive a free report to your inbox several times a week.
-- Quarterly charts and comments
--For more analysis and trade setups (including current positions and the ‘watchlist’), visit SB Trade Desk
Weekly
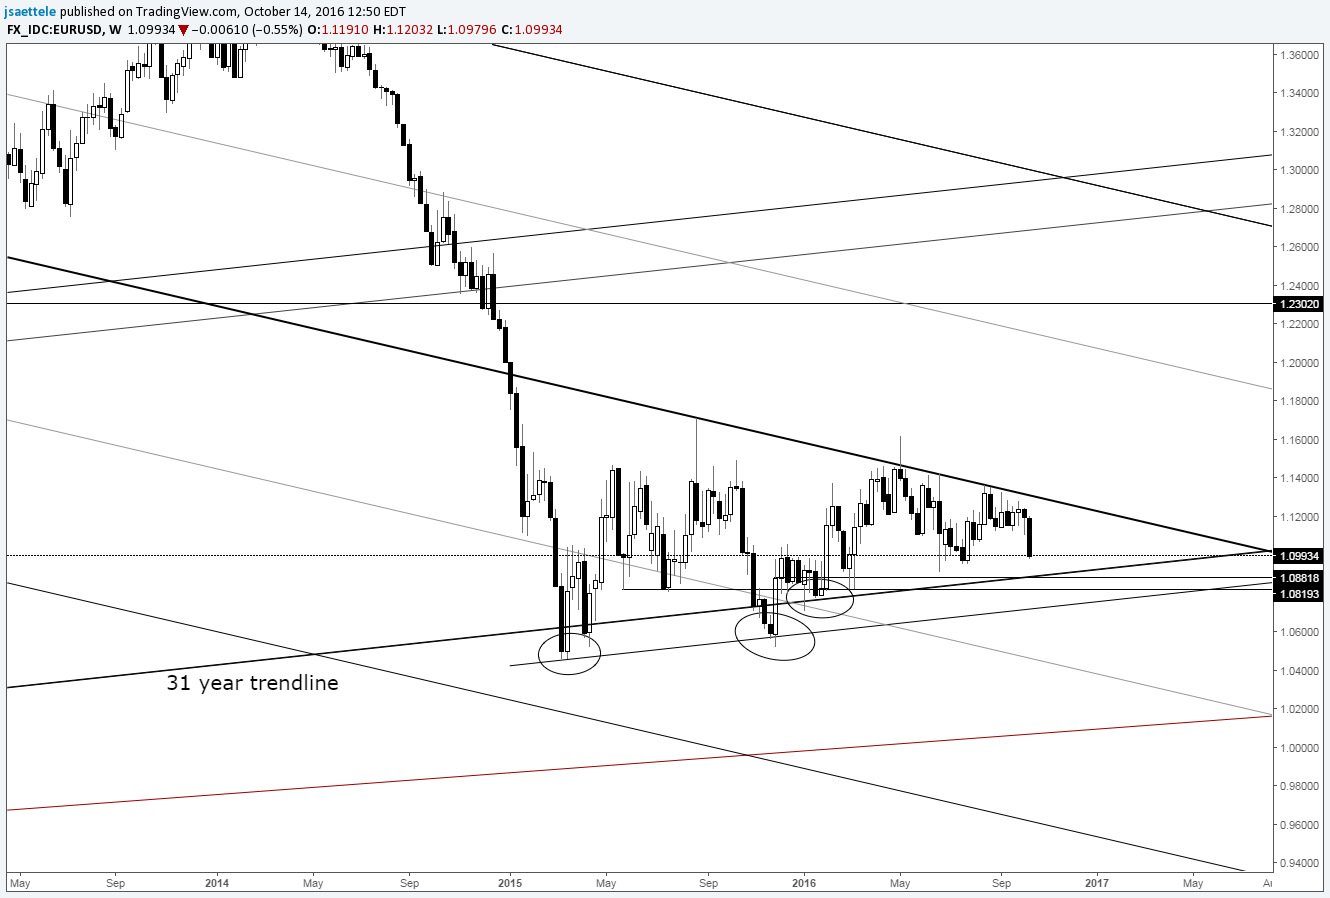
Chart Prepared by Jamie Saettele, CMT
See REAL TIME trader positioning
High Frequency Trading Tools
-EUR/USD has broken down on the daily but remains within a range on the weekly chart. The near term breakdown could certainly ‘launch’ a more important move but there are several levels to pay attention to in the event that this move is a trap. The notable level to watch is the 30 year trendline near 1.0880. The other spot to watch is 1.0820; the May and July 2015 lows. As noted last week, “the 20 day range range is a measly .92% right now. The lowest range 20 day range EVER was on 5/5/2014 at just .67%. The top was 3 trading days later. I’m wondering if the initial move out of the current tight range will similarly be a ‘false’ move before a trend takes hold.”
As always, define your risk points (read more about traits of successful traders here).
-For forecasts and 2016 opportunities, check out the DailyFX Trading Guides.
Weekly

Chart Prepared by Jamie Saettele, CMT
See REAL TIME trader positioning
-There is no change to the weekly Cable analysis. “There may be no real support until early 2017 based on the 96 month (8 year) cycle low count. That cycle count is shown on this chart. A price level of interest is where the decline from the 2014 high (1.7191) would be equal to the 2007-2009 decline in percentage terms (36% declines). The math produces 1.0970.”
Weekly
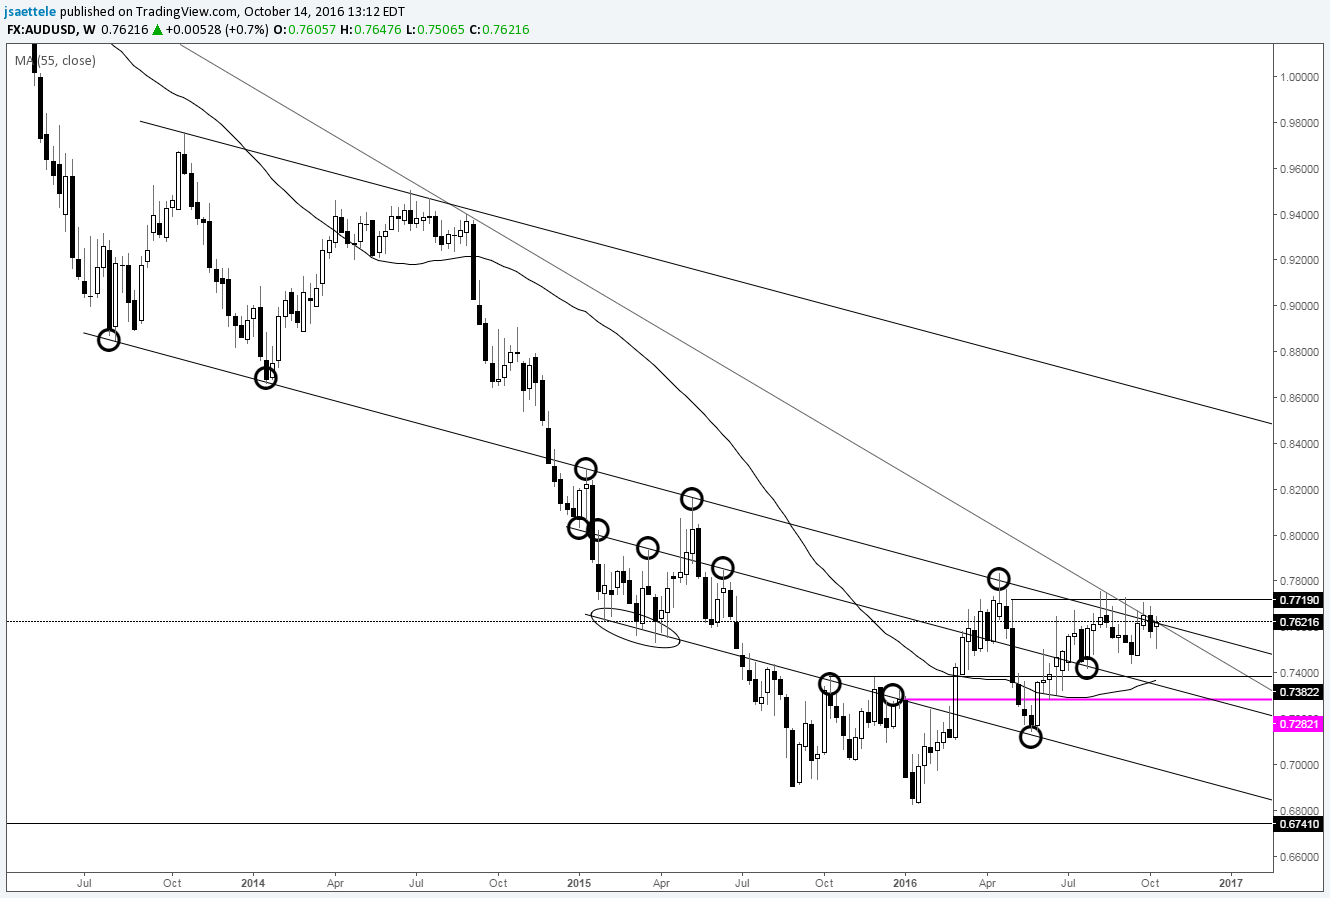
Chart Prepared by Jamie Saettele, CMT
See REAL TIME trader positioning
-AUD/USD remains capped by major slope resistance after finding low earlier in the year at ‘macro’ slope support (see the link to the quarterly charts at the beginning of the report). The bullish breakout level (weekly closing basis) is .7719. Strength through there would signal that a basing process is complete for a move to the mid-.80s. Until then, scope remains for additional range trade with support near .7380 (October and December 2015 highs).
Weekly
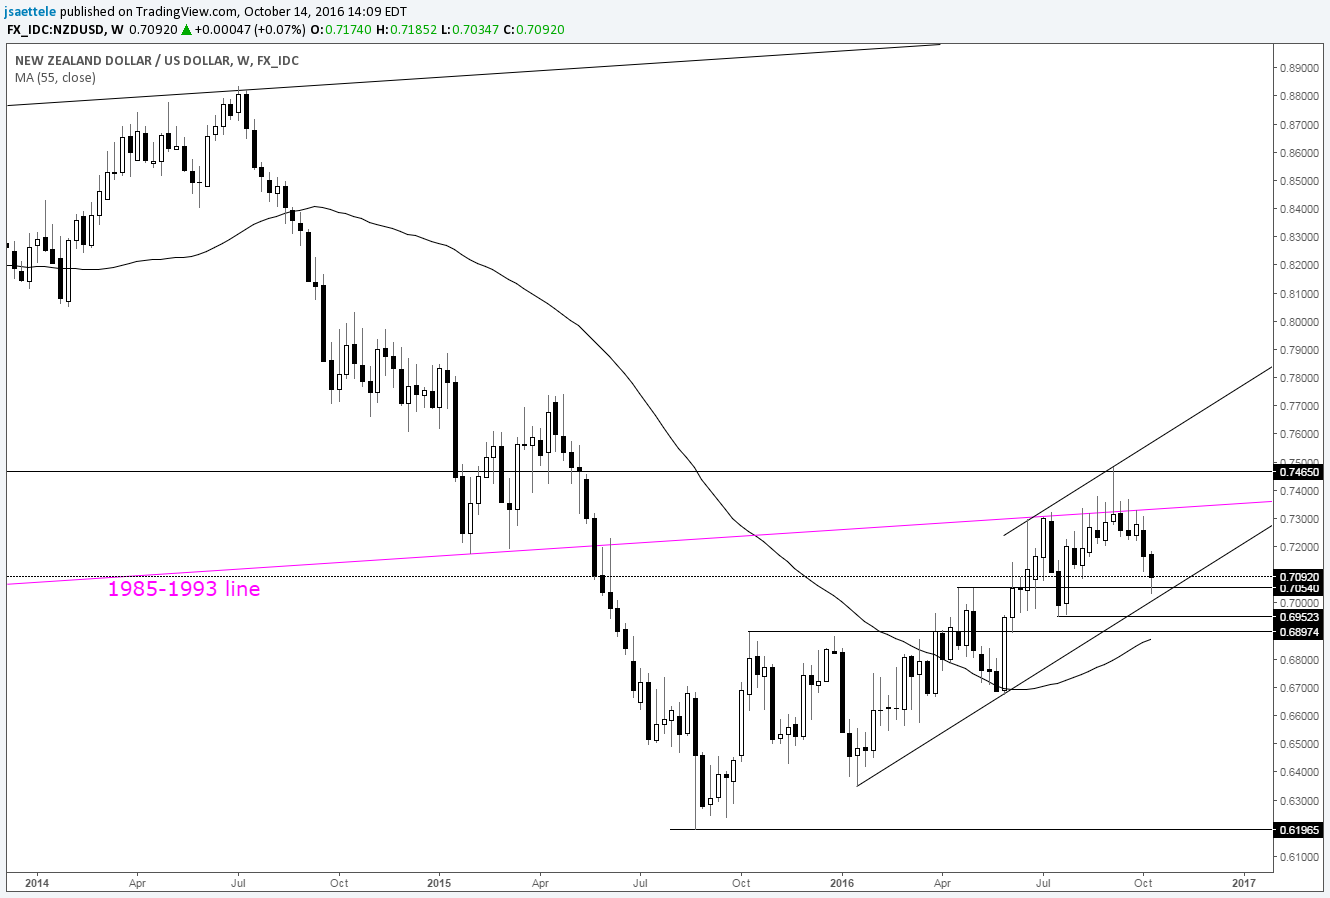
Chart Prepared by Jamie Saettele, CMT
See REAL TIME trader positioning
-The 1985-1993 line has been resistance since June. In fact, Kiwi was never able close above the line on a weekly basis (plenty of wicks above). This past week’s decline brings the first big test for bears in the form of the January-May trendline. Failure to hold would expose the October 2015 high and 55 week average near .6900. Strength above .7200 is needed in order to point higher.
Weekly
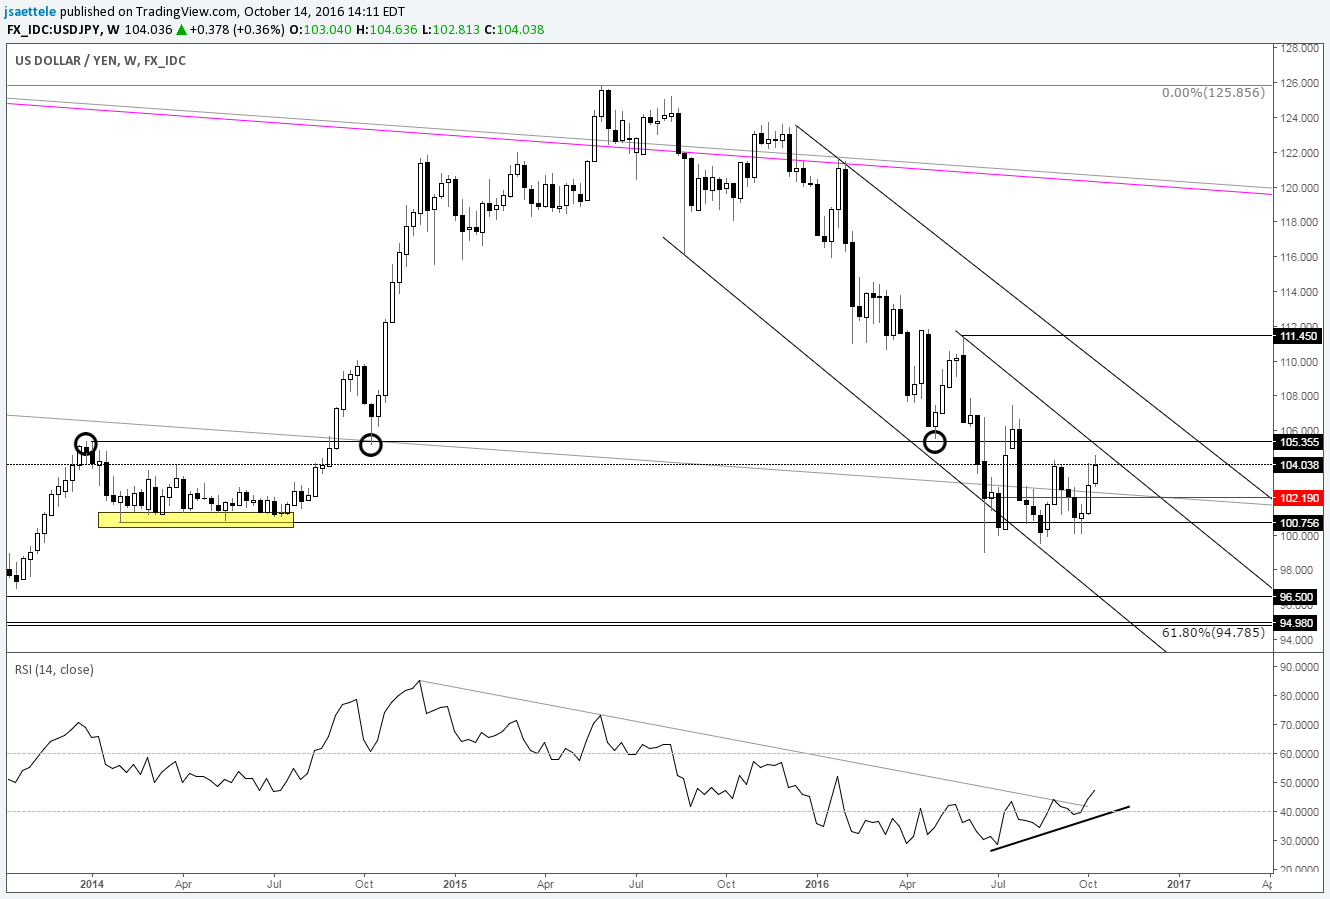
Chart Prepared by Jamie Saettele, CMT
See REAL TIME trader positioning
-The recent quarterly update remarked that “the area around 100 is clearly important (see lows in 1999, 2000, 2005, 2014, and the 2009 high)…don’t be shocked if USD/JPY surprises higher in Q4.” The push above the September high is a positive but the big test for this rally is the May low at 105.44 (same area code as the January 2014 high and October 2014 low…remember what the BoJ did in October 2014…and October 2011).
USD/CAD
Weekly

Chart Prepared by Jamie Saettele, CMT
See REAL TIME trader positioning
-USD/CAD might be about to fall off of a cliff. The 55 week average has been resistance since May. The average had been support since 2013 so the behavior change (former support becoming resistance) should be taken seriously. Further, action since the May low qualifies as a wedge. The target on a wedge break would be the May 2015 low at 1.1919. Meanwhile, strength through 1.3300 could carry to 1.38 (not the ‘preferred’ view).
Weekly

Chart Prepared by Jamie Saettele, CMT
See REAL TIME trader positioning
-USD/CHF continues to trade on a parallel to the 1985-2001 trendline (that line is not shown on this chart…it is near 1.0060). The line has been resistance since October 2006 on each advance so a break higher would be a game changer and target the trendline near 1.1500. Swissie has also reached an important pivot in time (see the link to the quarterly report at the beginning of this report). Q3 is 63 quarters from the 2000 high. The 2000 high is 63 quarters from the 1985 high. The way I see it, the symmetry warns of a shift in conditions; from range to a MOVE. The 2011-2014 trendline remains the trigger for a downside break. The November 2015-January trendline and recent highs are an important near term pivot at .9950. Given the long term symmetry, caution is urged as per SNB history.
Bonus Chart
30 Year U.S. Treasury Bond Future
Quarterly
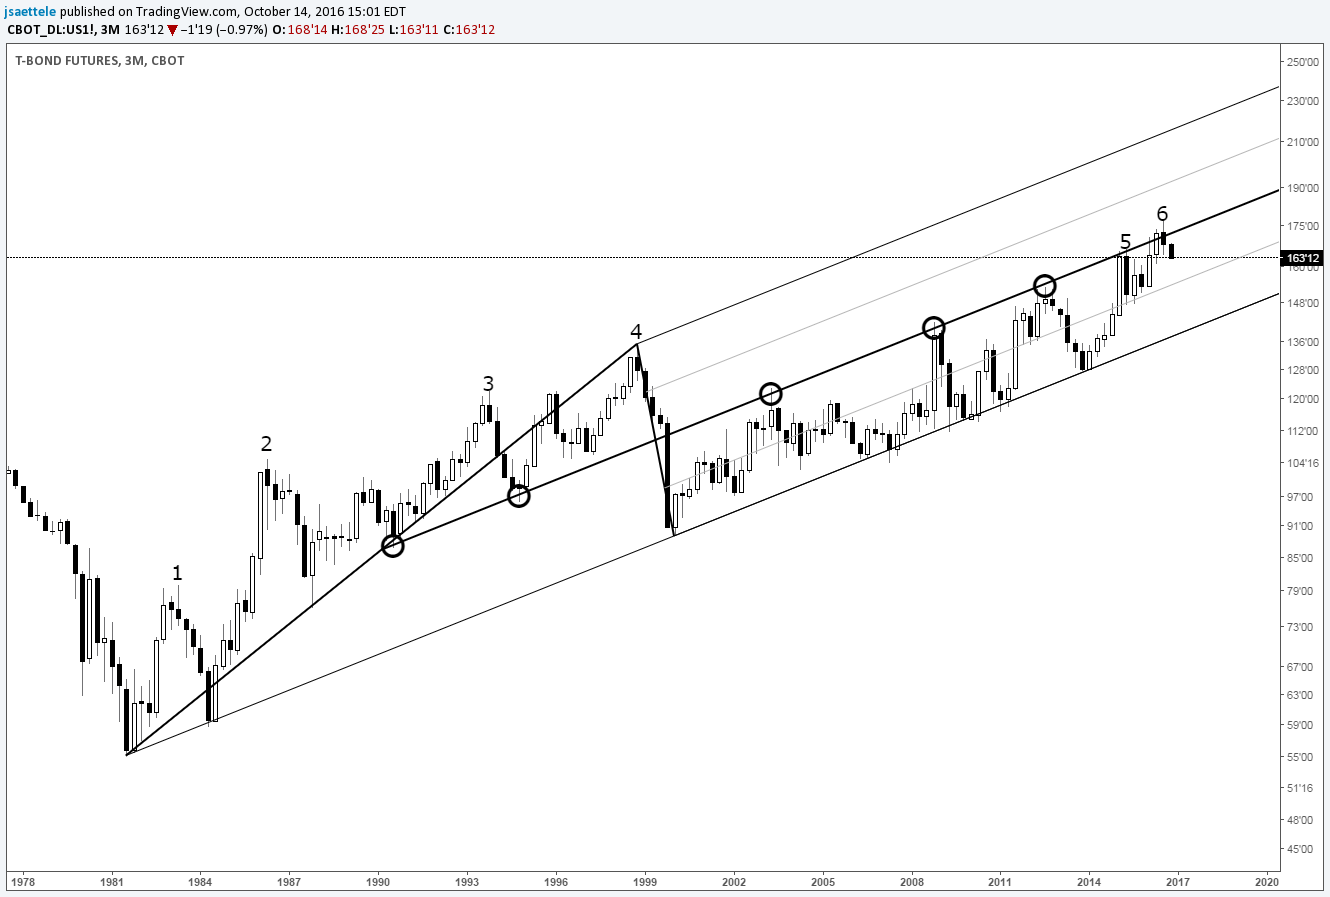
Chart Prepared by Jamie Saettele, CMT
-I’ve followed the U.S. bond market with increased interest this year due to the long term channels and a looming time relationship (read about that here). Long story short; the time relationship registers in February 2017, which is when the rally from 1981 would consist of 2 equal legs (in time). However, 3rd quarter developments warn that a top is in place now. What happened in the 3rd quarter? A key reversal! Since the 1981 low, there have been 6 quarterly key reversals when the bonds were at trend highs. The one that wasn’t a top was Q2 2015. Today’s drop (10/14) broke the Q3 low, confirming the key reversal as a signal. Higher rates are already making headlines. This chart warns that it’s just the beginning.


