


- USD/JPY rockets off of long term horizontal level
- NZD/USD weekly key reversal
- Big level in lumber just above
-- Subscribe to Jamie Saettele's distribution list in order to receive a free report to your inbox several times a week.
--For more analysis and trade setups (including current positions and the ‘watchlist’), visit SB Trade Desk
--Free trading tips
Weekly
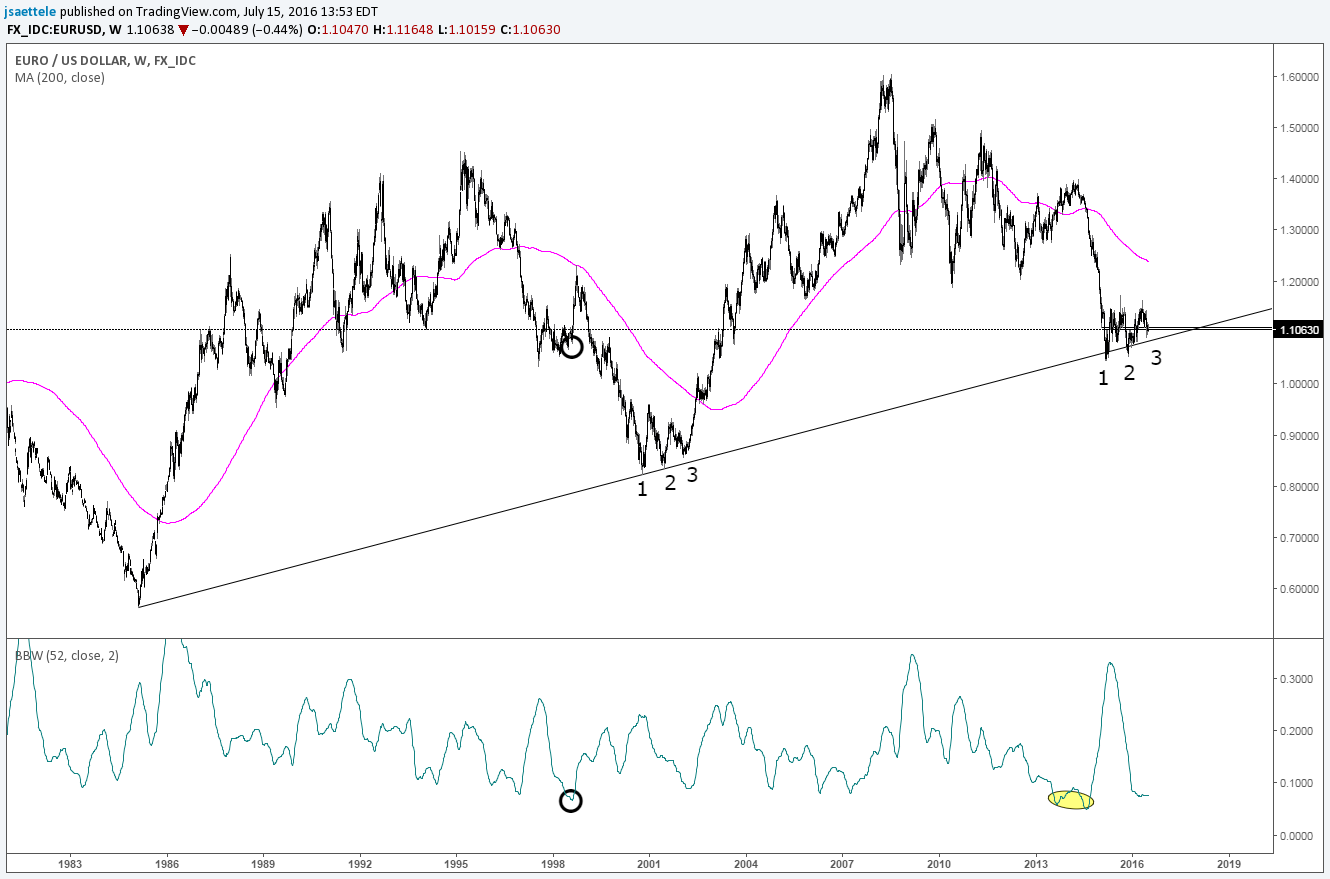
Chart Prepared by Jamie Saettele, CMT
See REAL TIME trader positioning
High Frequency Trading Tools
-FXTW wrote in early May that “EUR/USD broke through (resistance) on an intraweek basis but finished the week with a long upper wick that warns of a ‘bull trap’. It seems right to be (long term) bullish given the 31 year trendline support but the breakout may have to wait a bit. As always, define your risk points (read more about traits of successful traders here). FXTW was also of the mind however that the May low at 1.1097 would hold…then Brexit happened. A broad view reveals that nothing has really changed however. 52 week Bollinger Band ® width on EUR/USD is at the lower end of its historical range. Volatility is mean reverting so prepare for a change in market conditions from range to trend.
-For forecasts and 2016 opportunities, check out the DailyFX Trading Guides.
Weekly
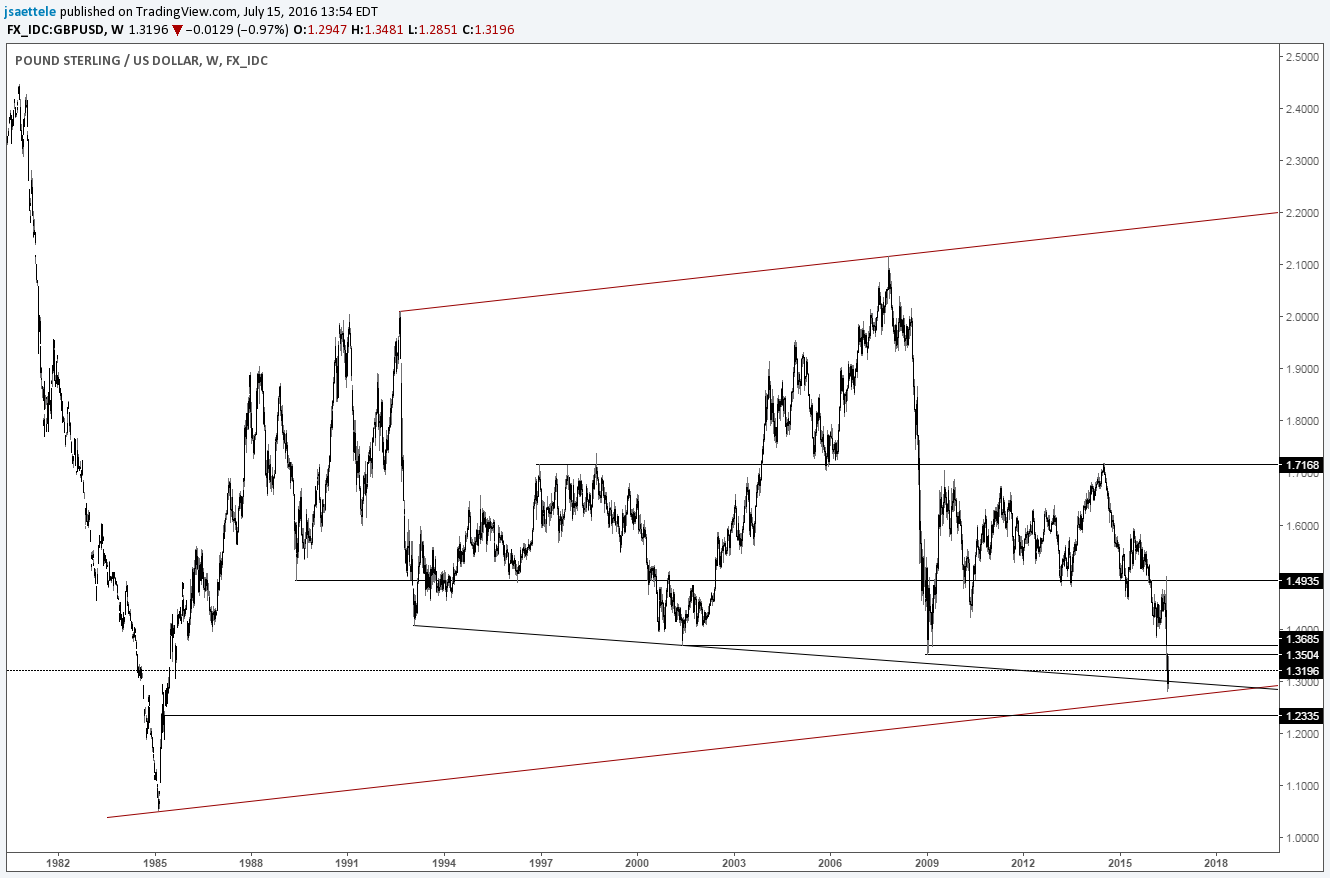
Chart Prepared by Jamie Saettele, CMT
See REAL TIME trader positioning
-Last week’s GBP/USD update noted that “the gap to open trading post-Brexit is thus far of the breakaway variety. The current level (slope lines) and/or 1.2500 could inspire a ‘squeeze’ as part of consolidation before another leg lower. 1.2500 relates the 2009-2014 range (127.2% of that range from the 2014 high) and decline from 2007 (decline from 2014 = .618% of 2007-2008 decline). Former supports at 1.3500-1.3700 should now be watched for resistance. Remember, there is a 96 month (8 year) cycle low count.” Cable recovered this week and nearly reached 1.3500 on Friday. It’s difficult to be bearish into the mentioned long term supports (1.2800 and 1.2500). Continue to focus on the 1.3500-1.3700 zone for reactions.
Weekly

Chart Prepared by Jamie Saettele, CMT
See REAL TIME trader positioning
-There is no change to the weekly AUD/USD analysis. “AUD/USD is constructive because former support turned resistance was support again several weeks ago (from a parallel). What’s more, this week’s low registered a few ticks above the opening price for the year (we call this the ‘touch and go’ over at SB Trade Desk). The next decision point may be above .7700 (the next parallel).”
NZD/USD
Weekly

Chart Prepared by Jamie Saettele, CMT
See REAL TIME trader positioning
-The last NZD/USD weekly update noted that “a long term parallel and major horizontal levels (including the 1988 high) could cap the rally from August 2015 while a break above this level would be a significant development. Bottom line, the current juncture commands attention as a major decision point.” Kiwi has been trading around this long term inflection point (line off of the 1985 and 1993 lows) for 4 weeks and this week’s weekly key reversal might cap the rally.
USD/JPY
Weekly

Chart Prepared by Jamie Saettele, CMT
See REAL TIME trader positioning
-FXTW wrote last week that “price has stabilized in the vicinity of the noted 2000 and 2014 lows but whether or not the last week is a pause or a change in trend is unanswerable. Strength above 105.40 is needed in order to suggest that the upside is again viable. Until then, the area around 95 (next historical inflection point and 61.8% of rally from 2011) looms as a magnet.” USD/JPY turned up sharply from the well-defined long term horizontal level and is ending the week near 105.40 (May low, January 2014 high, and just above the October 2014 low). Traction above here would be a positive.
Weekly
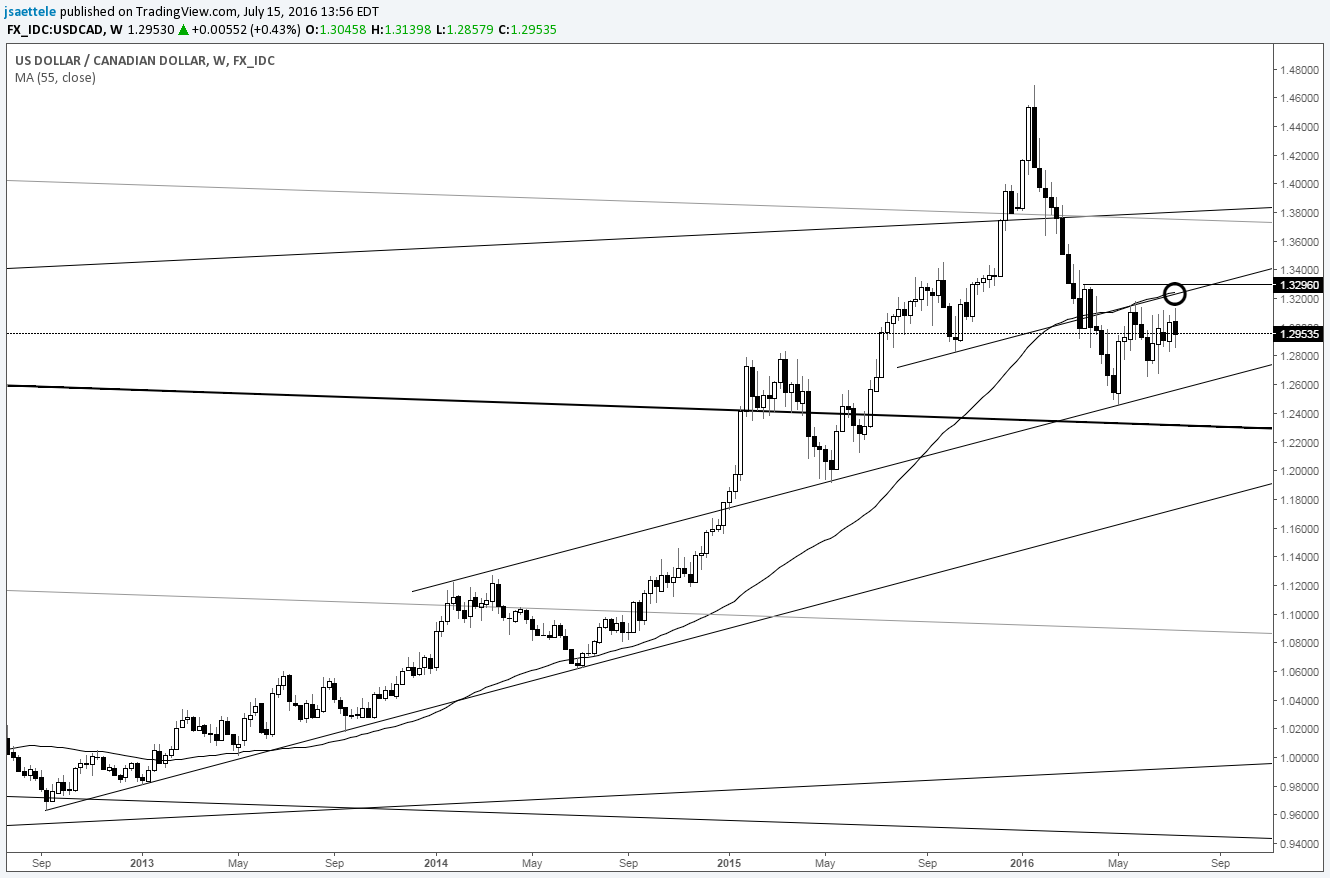
Chart Prepared by Jamie Saettele, CMT
See REAL TIME trader positioning
-There are no new comments regarding the USD/CAD weekly chart other than noting that consolidation just completed its 10th week. “The bullish engulfing candle from May is still there of course but the rally has failed at the 55 week average. FXTW pays attention to this because this average was support for the last 3 years. Former support just provided resistance so USD/CAD may be transitioning to a bearish phase.”
Weekly
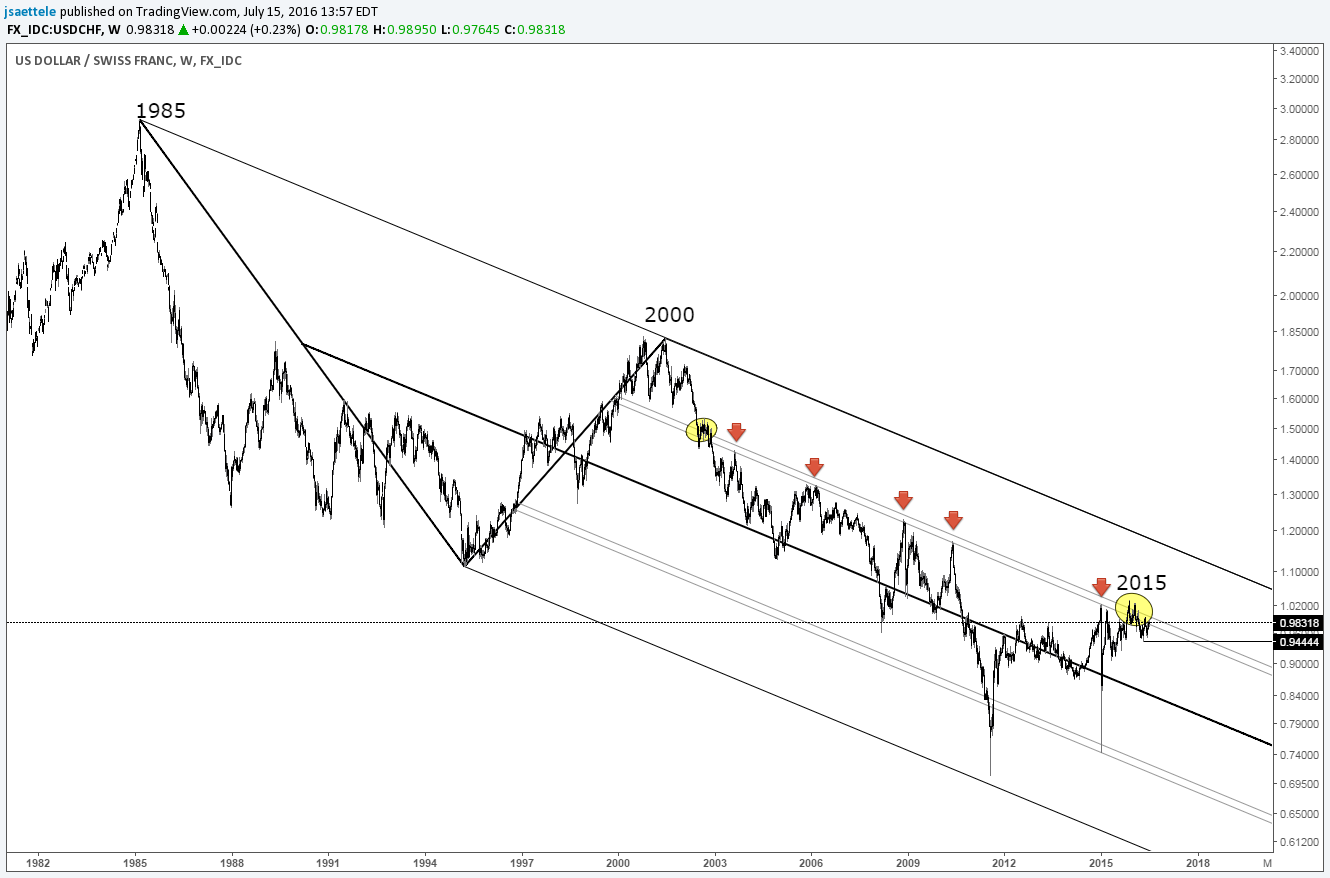
Chart Prepared by Jamie Saettele, CMT
See REAL TIME trader positioning
-FXTW was following a bullish wedge pattern from the November high. This pattern completed on 5/18. The pattern then failed on 6/6. A failed bullish pattern serves as a bearish warning. In fact, FXTW wrote recently that “a failed wedge would not be a surprise given the struggle at LONG TERM resistance since November.” Weakness below .9440 could usher in a ‘waterfall decline’.
Bonus Chart
Lumber Futures with NZD/USD (closes)
Weekly
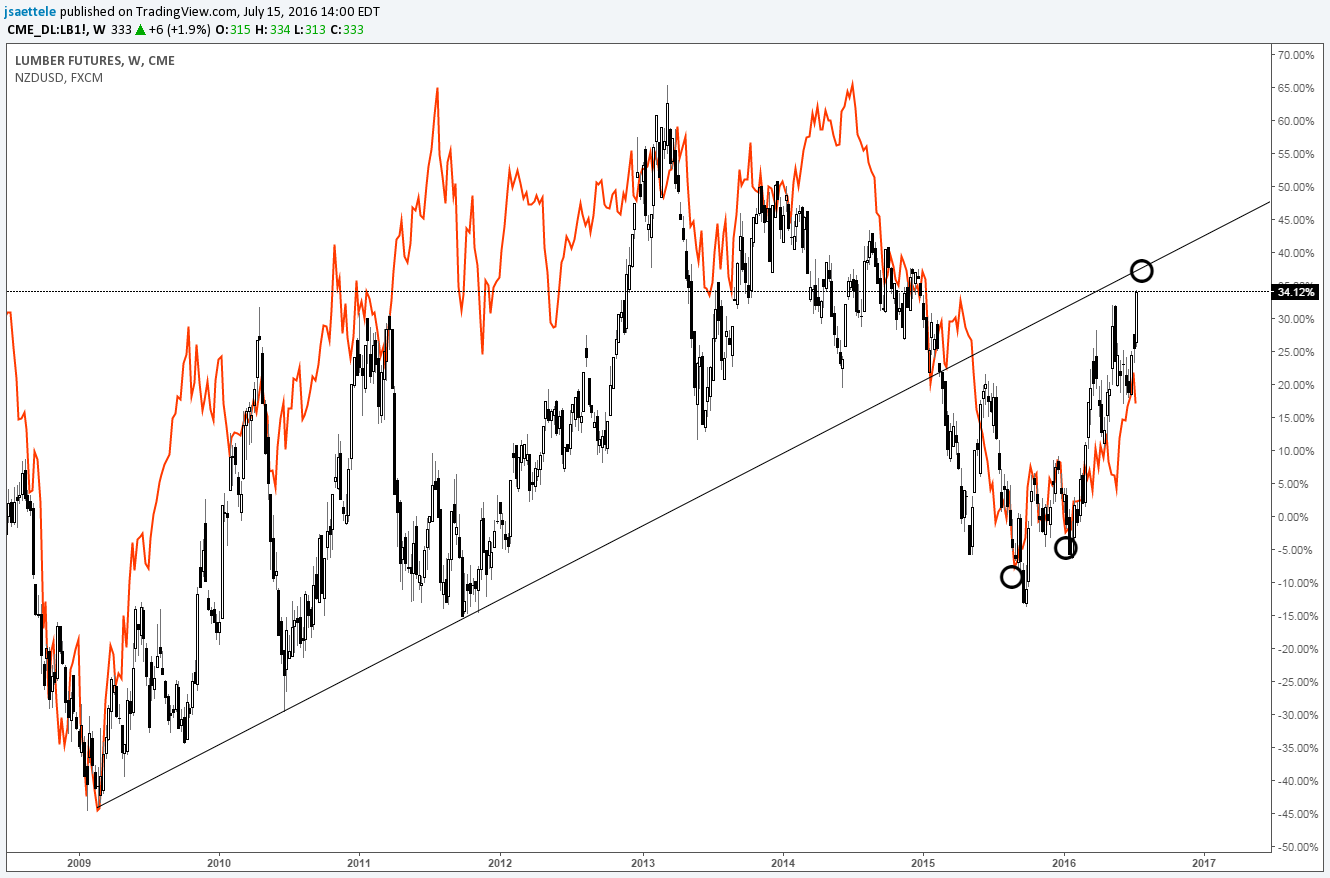
Chart Prepared by Jamie Saettele, CMT
See REAL TIME trader positioning
Many Kiwi traders are probably aware of the importance of the dairy trade to the New Zealand economy and NZD/USD exchange rate. Wood products are also a big export (so is meat…I’ll save that one for another day) so it’s not a bad idea to know what lumber futures are doing. Lumber is up 30% so far in 2016. Kiwi is up 5% and has been one of the year’s best performing currencies but just carved a weekly key reversal at long term resistance (see the chart earlier in this report) and cyclical influences are worth considering now. Interestingly, lumber futures are nearing a former major support line that connects the 2009, 2010, and 2011 lows. This line should be watched for resistance in lumber.
The relationship between lumber and Kiwi isn’t always clean but has been since the 2015 low. In fact, Kiwi has turned ahead of lumber since bottoming in August 2015. NZD/USD turned up 3 weeks before the September low in lumber, 1 week before the January low, and turned down 2 weeks before the May peak. So, the turn lower in Kiwi this week may be a harbinger of things to come for lumber, which is currently on fire (sorry). The strongest moves over the last year in NZD/USD have occurred when lumber is moving in the same direction. In other words, watch for lumber to turn down before both can accelerate lower together. We’ll be following this idea closely for entries in the coming weeks at SB Trade Desk.


